Delaware vs Immigrants from Micronesia Median Earnings
COMPARE
Delaware
Immigrants from Micronesia
Median Earnings
Median Earnings Comparison
Delaware
Immigrants from Micronesia
$44,783
MEDIAN EARNINGS
9.0/ 100
METRIC RATING
232nd/ 347
METRIC RANK
$41,133
MEDIAN EARNINGS
0.1/ 100
METRIC RATING
298th/ 347
METRIC RANK
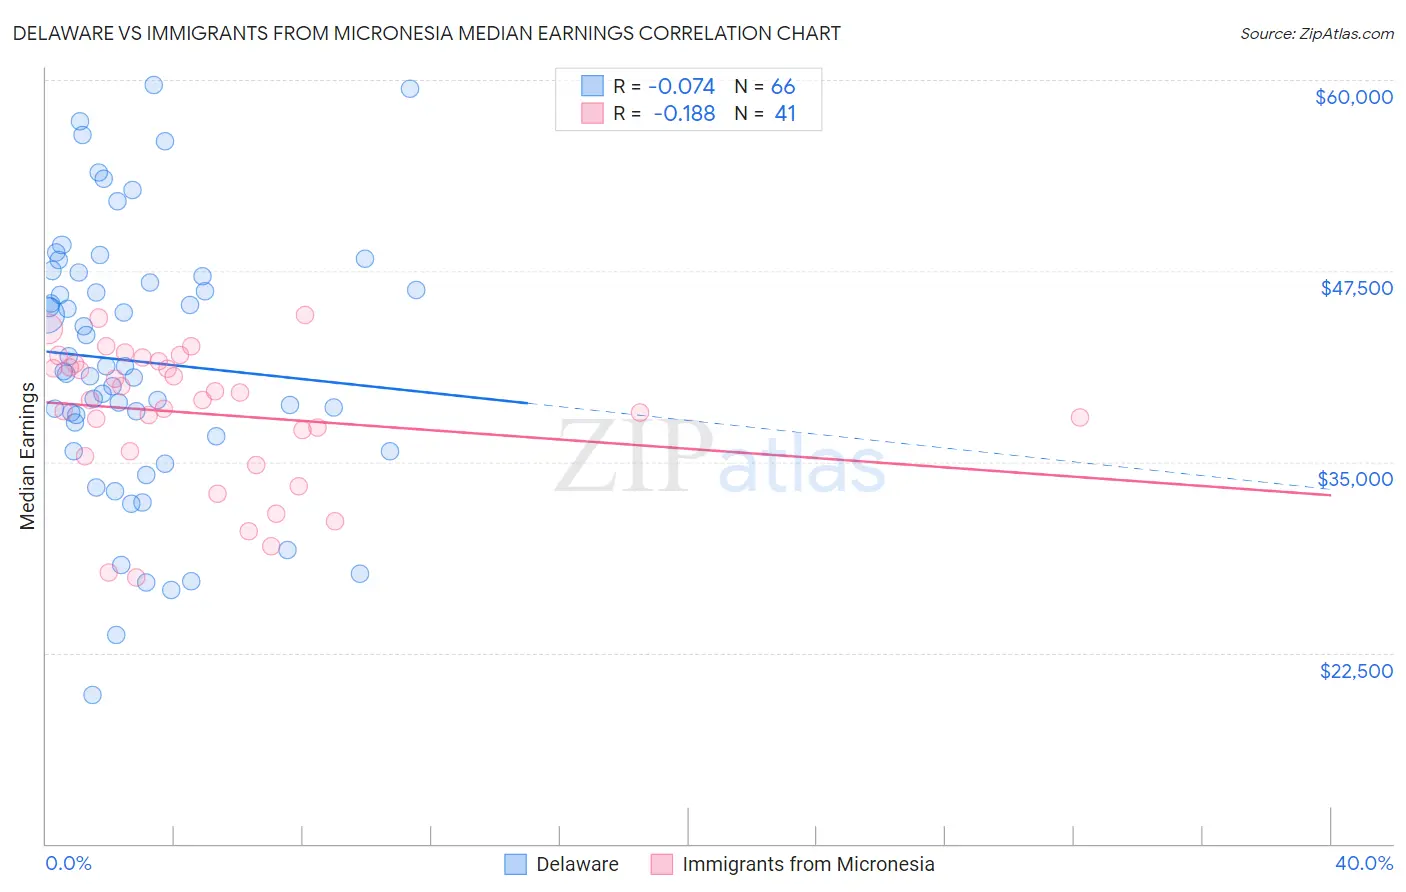
Delaware vs Immigrants from Micronesia Median Earnings Correlation Chart
The statistical analysis conducted on geographies consisting of 96,235,383 people shows a slight negative correlation between the proportion of Delaware and median earnings in the United States with a correlation coefficient (R) of -0.074 and weighted average of $44,783. Similarly, the statistical analysis conducted on geographies consisting of 61,606,741 people shows a poor negative correlation between the proportion of Immigrants from Micronesia and median earnings in the United States with a correlation coefficient (R) of -0.188 and weighted average of $41,133, a difference of 8.9%.
Median Earnings Correlation Summary
| Measurement | Delaware | Immigrants from Micronesia |
| Minimum | $19,766 | $27,399 |
| Maximum | $59,711 | $44,575 |
| Range | $39,945 | $17,176 |
| Mean | $41,572 | $38,171 |
| Median | $41,074 | $39,090 |
| Interquartile 25% (IQ1) | $36,711 | $35,550 |
| Interquartile 75% (IQ3) | $47,149 | $41,519 |
| Interquartile Range (IQR) | $10,438 | $5,969 |
| Standard Deviation (Sample) | $8,740 | $4,508 |
| Standard Deviation (Population) | $8,674 | $4,452 |
Similar Demographics by Median Earnings
Demographics Similar to Delaware by Median Earnings
In terms of median earnings, the demographic groups most similar to Delaware are Immigrants from Sudan ($44,767, a difference of 0.040%), Japanese ($44,825, a difference of 0.090%), Immigrants from Western Africa ($44,893, a difference of 0.24%), Scotch-Irish ($44,924, a difference of 0.32%), and Cape Verdean ($44,640, a difference of 0.32%).
| Demographics | Rating | Rank | Median Earnings |
| Immigrants | Cambodia | 13.2 /100 | #225 | Poor $45,090 |
| Immigrants | Nigeria | 12.2 /100 | #226 | Poor $45,030 |
| Native Hawaiians | 12.2 /100 | #227 | Poor $45,027 |
| Immigrants | Iraq | 11.6 /100 | #228 | Poor $44,988 |
| Scotch-Irish | 10.7 /100 | #229 | Poor $44,924 |
| Immigrants | Western Africa | 10.3 /100 | #230 | Poor $44,893 |
| Japanese | 9.5 /100 | #231 | Tragic $44,825 |
| Delaware | 9.0 /100 | #232 | Tragic $44,783 |
| Immigrants | Sudan | 8.8 /100 | #233 | Tragic $44,767 |
| Cape Verdeans | 7.5 /100 | #234 | Tragic $44,640 |
| Venezuelans | 6.9 /100 | #235 | Tragic $44,580 |
| British West Indians | 6.7 /100 | #236 | Tragic $44,552 |
| Immigrants | Ecuador | 5.9 /100 | #237 | Tragic $44,462 |
| Sudanese | 5.6 /100 | #238 | Tragic $44,419 |
| Senegalese | 5.3 /100 | #239 | Tragic $44,373 |
Demographics Similar to Immigrants from Micronesia by Median Earnings
In terms of median earnings, the demographic groups most similar to Immigrants from Micronesia are Immigrants from Caribbean ($41,119, a difference of 0.030%), Guatemalan ($41,205, a difference of 0.17%), Ute ($41,051, a difference of 0.20%), Immigrants from Latin America ($41,049, a difference of 0.20%), and Cherokee ($41,252, a difference of 0.29%).
| Demographics | Rating | Rank | Median Earnings |
| Central American Indians | 0.1 /100 | #291 | Tragic $41,474 |
| U.S. Virgin Islanders | 0.1 /100 | #292 | Tragic $41,448 |
| Immigrants | Zaire | 0.1 /100 | #293 | Tragic $41,325 |
| Potawatomi | 0.1 /100 | #294 | Tragic $41,288 |
| Bangladeshis | 0.1 /100 | #295 | Tragic $41,263 |
| Cherokee | 0.1 /100 | #296 | Tragic $41,252 |
| Guatemalans | 0.1 /100 | #297 | Tragic $41,205 |
| Immigrants | Micronesia | 0.1 /100 | #298 | Tragic $41,133 |
| Immigrants | Caribbean | 0.1 /100 | #299 | Tragic $41,119 |
| Ute | 0.1 /100 | #300 | Tragic $41,051 |
| Immigrants | Latin America | 0.1 /100 | #301 | Tragic $41,049 |
| Shoshone | 0.0 /100 | #302 | Tragic $40,932 |
| Haitians | 0.0 /100 | #303 | Tragic $40,918 |
| Immigrants | Guatemala | 0.0 /100 | #304 | Tragic $40,851 |
| Chickasaw | 0.0 /100 | #305 | Tragic $40,672 |