Paraguayan vs Immigrants from Canada Median Earnings
COMPARE
Paraguayan
Immigrants from Canada
Median Earnings
Median Earnings Comparison
Paraguayans
Immigrants from Canada
$51,068
MEDIAN EARNINGS
99.9/ 100
METRIC RATING
68th/ 347
METRIC RANK
$50,192
MEDIAN EARNINGS
99.5/ 100
METRIC RATING
86th/ 347
METRIC RANK
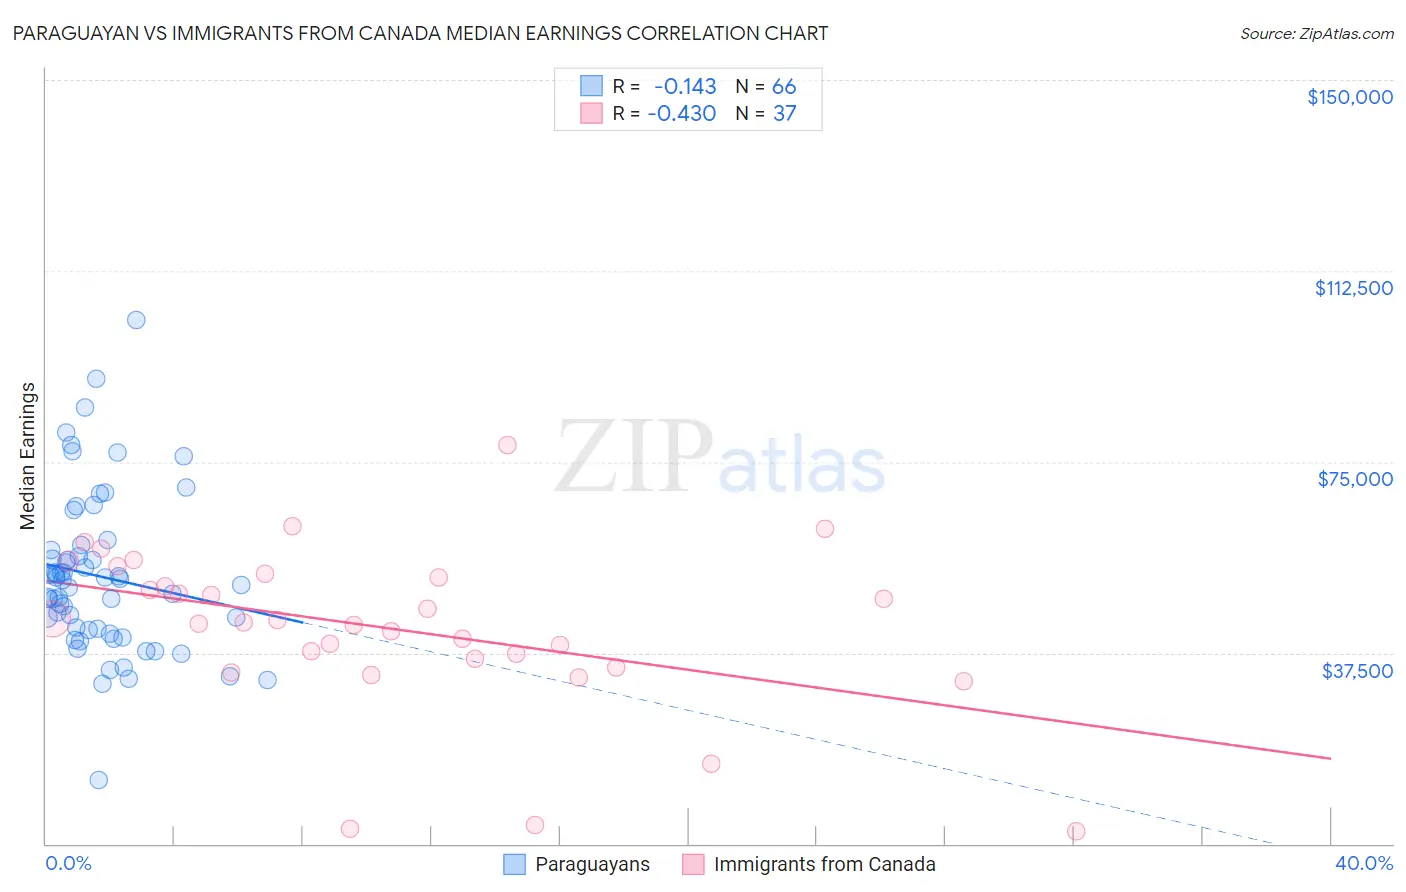
Paraguayan vs Immigrants from Canada Median Earnings Correlation Chart
The statistical analysis conducted on geographies consisting of 95,085,692 people shows a poor negative correlation between the proportion of Paraguayans and median earnings in the United States with a correlation coefficient (R) of -0.143 and weighted average of $51,068. Similarly, the statistical analysis conducted on geographies consisting of 459,326,577 people shows a moderate negative correlation between the proportion of Immigrants from Canada and median earnings in the United States with a correlation coefficient (R) of -0.430 and weighted average of $50,192, a difference of 1.8%.
Median Earnings Correlation Summary
| Measurement | Paraguayan | Immigrants from Canada |
| Minimum | $12,403 | $2,499 |
| Maximum | $102,750 | $78,310 |
| Range | $90,347 | $75,811 |
| Mean | $52,505 | $42,254 |
| Median | $51,405 | $43,536 |
| Interquartile 25% (IQ1) | $42,088 | $35,442 |
| Interquartile 75% (IQ3) | $57,643 | $52,692 |
| Interquartile Range (IQR) | $15,555 | $17,250 |
| Standard Deviation (Sample) | $15,766 | $16,214 |
| Standard Deviation (Population) | $15,646 | $15,993 |
Demographics Similar to Paraguayans and Immigrants from Canada by Median Earnings
In terms of median earnings, the demographic groups most similar to Paraguayans are Immigrants from Spain ($51,092, a difference of 0.050%), Mongolian ($51,038, a difference of 0.060%), Lithuanian ($50,991, a difference of 0.15%), Immigrants from Ukraine ($50,984, a difference of 0.16%), and Immigrants from Egypt ($50,901, a difference of 0.33%). Similarly, the demographic groups most similar to Immigrants from Canada are Immigrants from Hungary ($50,227, a difference of 0.070%), Immigrants from Kazakhstan ($50,225, a difference of 0.070%), Immigrants from Uzbekistan ($50,151, a difference of 0.080%), Romanian ($50,244, a difference of 0.10%), and Immigrants from Moldova ($50,274, a difference of 0.16%).
| Demographics | Rating | Rank | Median Earnings |
| Immigrants | Spain | 99.9 /100 | #67 | Exceptional $51,092 |
| Paraguayans | 99.9 /100 | #68 | Exceptional $51,068 |
| Mongolians | 99.8 /100 | #69 | Exceptional $51,038 |
| Lithuanians | 99.8 /100 | #70 | Exceptional $50,991 |
| Immigrants | Ukraine | 99.8 /100 | #71 | Exceptional $50,984 |
| Immigrants | Egypt | 99.8 /100 | #72 | Exceptional $50,901 |
| Immigrants | Netherlands | 99.8 /100 | #73 | Exceptional $50,818 |
| South Africans | 99.8 /100 | #74 | Exceptional $50,752 |
| Immigrants | Scotland | 99.8 /100 | #75 | Exceptional $50,741 |
| Immigrants | Italy | 99.7 /100 | #76 | Exceptional $50,581 |
| Immigrants | Western Europe | 99.7 /100 | #77 | Exceptional $50,549 |
| Argentineans | 99.6 /100 | #78 | Exceptional $50,399 |
| Laotians | 99.6 /100 | #79 | Exceptional $50,343 |
| Ukrainians | 99.6 /100 | #80 | Exceptional $50,320 |
| Immigrants | Southern Europe | 99.6 /100 | #81 | Exceptional $50,280 |
| Immigrants | Moldova | 99.5 /100 | #82 | Exceptional $50,274 |
| Romanians | 99.5 /100 | #83 | Exceptional $50,244 |
| Immigrants | Hungary | 99.5 /100 | #84 | Exceptional $50,227 |
| Immigrants | Kazakhstan | 99.5 /100 | #85 | Exceptional $50,225 |
| Immigrants | Canada | 99.5 /100 | #86 | Exceptional $50,192 |
| Immigrants | Uzbekistan | 99.5 /100 | #87 | Exceptional $50,151 |