Paraguayan vs Immigrants from Iran Unemployment Among Ages 55 to 59 years
COMPARE
Paraguayan
Immigrants from Iran
Unemployment Among Ages 55 to 59 years
Unemployment Among Ages 55 to 59 years Comparison
Paraguayans
Immigrants from Iran
5.1%
UNEMPLOYMENT AMONG AGES 55 TO 59 YEARS
0.3/ 100
METRIC RATING
253rd/ 347
METRIC RANK
5.0%
UNEMPLOYMENT AMONG AGES 55 TO 59 YEARS
3.7/ 100
METRIC RATING
227th/ 347
METRIC RANK
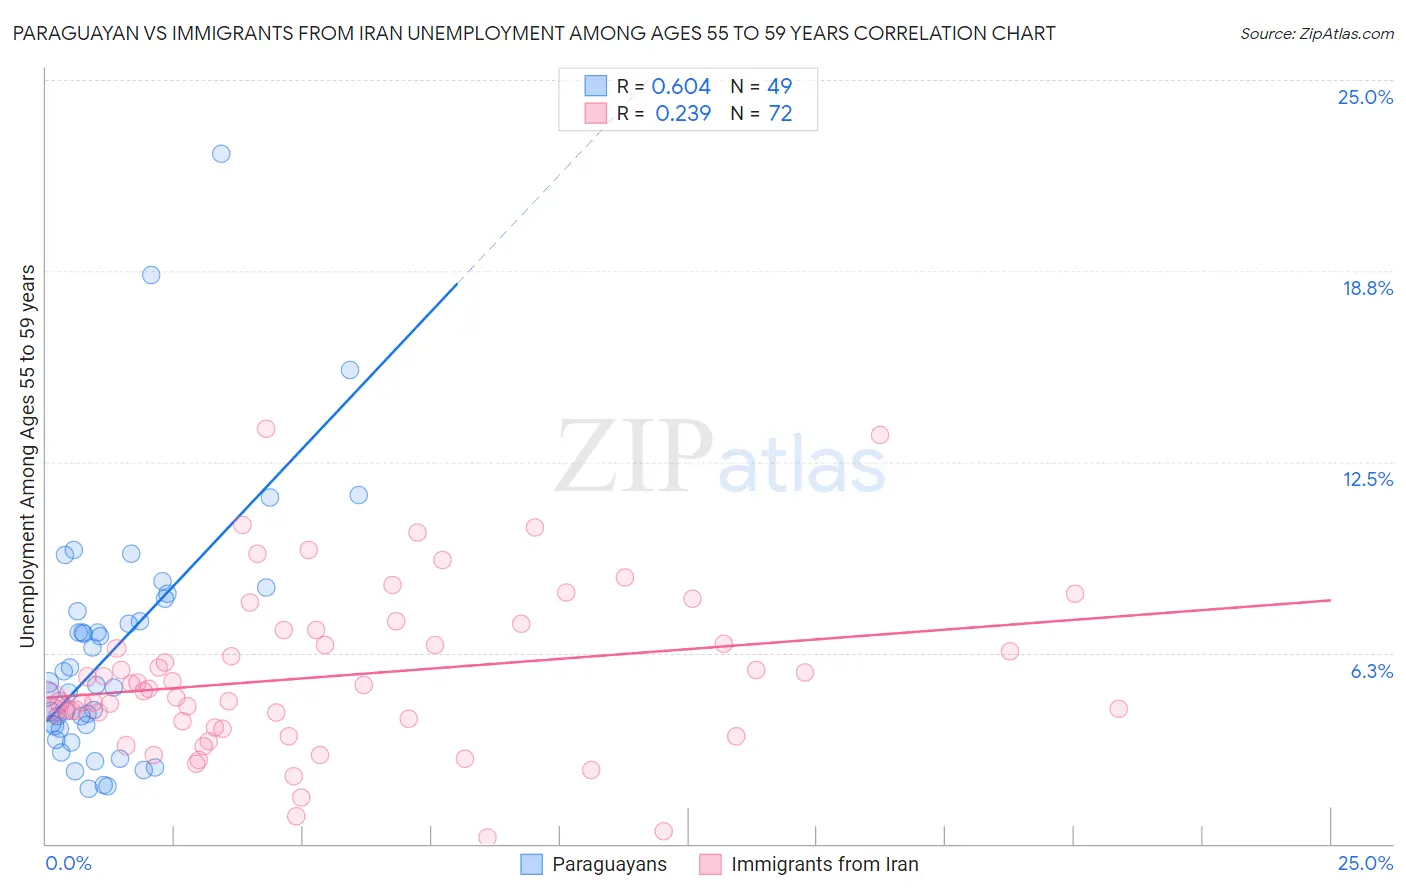
Paraguayan vs Immigrants from Iran Unemployment Among Ages 55 to 59 years Correlation Chart
The statistical analysis conducted on geographies consisting of 93,396,026 people shows a significant positive correlation between the proportion of Paraguayans and unemployment rate among population between the ages 55 and 59 in the United States with a correlation coefficient (R) of 0.604 and weighted average of 5.1%. Similarly, the statistical analysis conducted on geographies consisting of 268,472,905 people shows a weak positive correlation between the proportion of Immigrants from Iran and unemployment rate among population between the ages 55 and 59 in the United States with a correlation coefficient (R) of 0.239 and weighted average of 5.0%, a difference of 2.4%.
Unemployment Among Ages 55 to 59 years Correlation Summary
| Measurement | Paraguayan | Immigrants from Iran |
| Minimum | 1.8% | 0.20% |
| Maximum | 22.6% | 13.6% |
| Range | 20.8% | 13.4% |
| Mean | 6.3% | 5.5% |
| Median | 5.2% | 5.0% |
| Interquartile 25% (IQ1) | 3.8% | 3.9% |
| Interquartile 75% (IQ3) | 7.8% | 6.8% |
| Interquartile Range (IQR) | 4.0% | 2.9% |
| Standard Deviation (Sample) | 4.1% | 2.7% |
| Standard Deviation (Population) | 4.1% | 2.6% |
Similar Demographics by Unemployment Among Ages 55 to 59 years
Demographics Similar to Paraguayans by Unemployment Among Ages 55 to 59 years
In terms of unemployment among ages 55 to 59 years, the demographic groups most similar to Paraguayans are Seminole (5.1%, a difference of 0.030%), U.S. Virgin Islander (5.1%, a difference of 0.040%), Portuguese (5.1%, a difference of 0.060%), Blackfeet (5.1%, a difference of 0.10%), and Cheyenne (5.1%, a difference of 0.13%).
| Demographics | Rating | Rank | Unemployment Among Ages 55 to 59 years |
| Immigrants | Greece | 0.6 /100 | #246 | Tragic 5.1% |
| Immigrants | Honduras | 0.5 /100 | #247 | Tragic 5.1% |
| Native Hawaiians | 0.5 /100 | #248 | Tragic 5.1% |
| Comanche | 0.4 /100 | #249 | Tragic 5.1% |
| Cheyenne | 0.4 /100 | #250 | Tragic 5.1% |
| Portuguese | 0.3 /100 | #251 | Tragic 5.1% |
| U.S. Virgin Islanders | 0.3 /100 | #252 | Tragic 5.1% |
| Paraguayans | 0.3 /100 | #253 | Tragic 5.1% |
| Seminole | 0.3 /100 | #254 | Tragic 5.1% |
| Blackfeet | 0.3 /100 | #255 | Tragic 5.1% |
| Senegalese | 0.3 /100 | #256 | Tragic 5.1% |
| Central Americans | 0.2 /100 | #257 | Tragic 5.1% |
| Salvadorans | 0.2 /100 | #258 | Tragic 5.1% |
| Immigrants | West Indies | 0.2 /100 | #259 | Tragic 5.1% |
| Immigrants | Western Africa | 0.2 /100 | #260 | Tragic 5.1% |
Demographics Similar to Immigrants from Iran by Unemployment Among Ages 55 to 59 years
In terms of unemployment among ages 55 to 59 years, the demographic groups most similar to Immigrants from Iran are Immigrants from China (5.0%, a difference of 0.13%), Immigrants from Liberia (5.0%, a difference of 0.13%), Costa Rican (5.0%, a difference of 0.18%), Subsaharan African (5.0%, a difference of 0.19%), and Immigrants from Western Asia (5.0%, a difference of 0.21%).
| Demographics | Rating | Rank | Unemployment Among Ages 55 to 59 years |
| Indians (Asian) | 7.6 /100 | #220 | Tragic 4.9% |
| Nigerians | 7.5 /100 | #221 | Tragic 4.9% |
| Spanish | 5.1 /100 | #222 | Tragic 5.0% |
| Immigrants | Ireland | 4.8 /100 | #223 | Tragic 5.0% |
| Sub-Saharan Africans | 4.4 /100 | #224 | Tragic 5.0% |
| Costa Ricans | 4.4 /100 | #225 | Tragic 5.0% |
| Immigrants | China | 4.2 /100 | #226 | Tragic 5.0% |
| Immigrants | Iran | 3.7 /100 | #227 | Tragic 5.0% |
| Immigrants | Liberia | 3.2 /100 | #228 | Tragic 5.0% |
| Immigrants | Western Asia | 3.0 /100 | #229 | Tragic 5.0% |
| Immigrants | Syria | 2.7 /100 | #230 | Tragic 5.0% |
| Cherokee | 2.6 /100 | #231 | Tragic 5.0% |
| Albanians | 2.5 /100 | #232 | Tragic 5.0% |
| Immigrants | Immigrants | 2.3 /100 | #233 | Tragic 5.0% |
| Immigrants | Southern Europe | 1.8 /100 | #234 | Tragic 5.0% |