Immigrants from Europe vs Immigrants from El Salvador Median Female Earnings
COMPARE
Immigrants from Europe
Immigrants from El Salvador
Median Female Earnings
Median Female Earnings Comparison
Immigrants from Europe
Immigrants from El Salvador
$43,523
MEDIAN FEMALE EARNINGS
100.0/ 100
METRIC RATING
45th/ 347
METRIC RANK
$36,673
MEDIAN FEMALE EARNINGS
0.2/ 100
METRIC RATING
274th/ 347
METRIC RANK
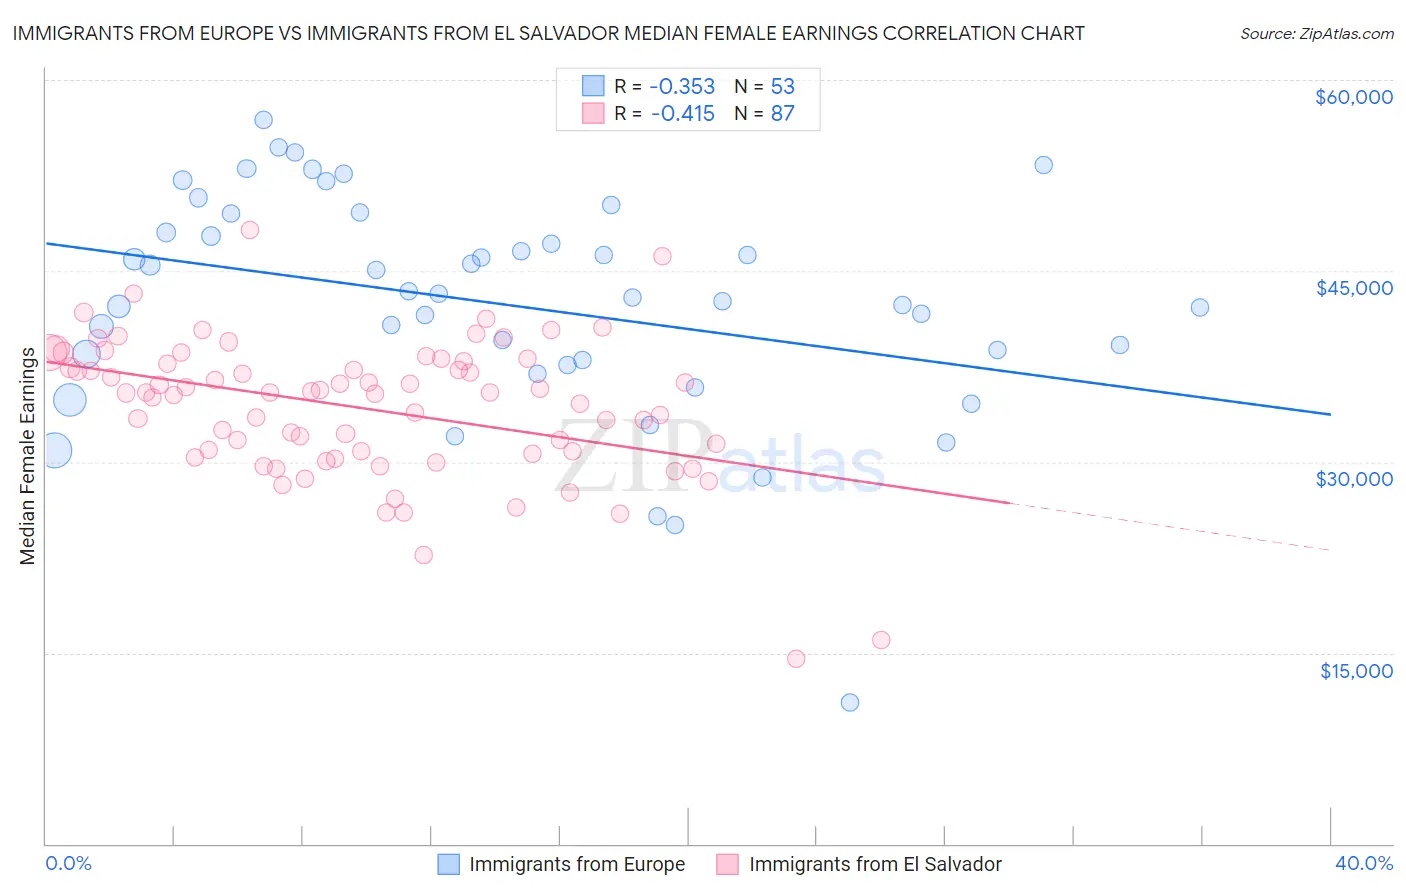
Immigrants from Europe vs Immigrants from El Salvador Median Female Earnings Correlation Chart
The statistical analysis conducted on geographies consisting of 546,402,948 people shows a mild negative correlation between the proportion of Immigrants from Europe and median female earnings in the United States with a correlation coefficient (R) of -0.353 and weighted average of $43,523. Similarly, the statistical analysis conducted on geographies consisting of 357,700,398 people shows a moderate negative correlation between the proportion of Immigrants from El Salvador and median female earnings in the United States with a correlation coefficient (R) of -0.415 and weighted average of $36,673, a difference of 18.7%.
Median Female Earnings Correlation Summary
| Measurement | Immigrants from Europe | Immigrants from El Salvador |
| Minimum | $11,071 | $14,546 |
| Maximum | $56,832 | $48,246 |
| Range | $45,761 | $33,701 |
| Mean | $42,400 | $34,218 |
| Median | $42,947 | $35,415 |
| Interquartile 25% (IQ1) | $37,781 | $30,625 |
| Interquartile 75% (IQ3) | $48,760 | $37,872 |
| Interquartile Range (IQR) | $10,979 | $7,247 |
| Standard Deviation (Sample) | $8,815 | $5,551 |
| Standard Deviation (Population) | $8,731 | $5,519 |
Similar Demographics by Median Female Earnings
Demographics Similar to Immigrants from Europe by Median Female Earnings
In terms of median female earnings, the demographic groups most similar to Immigrants from Europe are Immigrants from Czechoslovakia ($43,571, a difference of 0.11%), Immigrants from Bolivia ($43,467, a difference of 0.13%), Bolivian ($43,445, a difference of 0.18%), Bulgarian ($43,638, a difference of 0.26%), and Immigrants from Indonesia ($43,412, a difference of 0.26%).
| Demographics | Rating | Rank | Median Female Earnings |
| Latvians | 100.0 /100 | #38 | Exceptional $43,941 |
| Israelis | 100.0 /100 | #39 | Exceptional $43,852 |
| Immigrants | Malaysia | 100.0 /100 | #40 | Exceptional $43,835 |
| Bhutanese | 100.0 /100 | #41 | Exceptional $43,648 |
| Immigrants | Denmark | 100.0 /100 | #42 | Exceptional $43,646 |
| Bulgarians | 100.0 /100 | #43 | Exceptional $43,638 |
| Immigrants | Czechoslovakia | 100.0 /100 | #44 | Exceptional $43,571 |
| Immigrants | Europe | 100.0 /100 | #45 | Exceptional $43,523 |
| Immigrants | Bolivia | 100.0 /100 | #46 | Exceptional $43,467 |
| Bolivians | 100.0 /100 | #47 | Exceptional $43,445 |
| Immigrants | Indonesia | 100.0 /100 | #48 | Exceptional $43,412 |
| Immigrants | Serbia | 100.0 /100 | #49 | Exceptional $43,385 |
| Immigrants | Uzbekistan | 100.0 /100 | #50 | Exceptional $43,363 |
| Maltese | 100.0 /100 | #51 | Exceptional $43,357 |
| Immigrants | Lithuania | 99.9 /100 | #52 | Exceptional $43,317 |
Demographics Similar to Immigrants from El Salvador by Median Female Earnings
In terms of median female earnings, the demographic groups most similar to Immigrants from El Salvador are African ($36,530, a difference of 0.39%), Immigrants from Laos ($36,841, a difference of 0.46%), Central American ($36,492, a difference of 0.49%), Immigrants from Dominican Republic ($36,857, a difference of 0.50%), and Marshallese ($36,459, a difference of 0.59%).
| Demographics | Rating | Rank | Median Female Earnings |
| Immigrants | Nonimmigrants | 0.4 /100 | #267 | Tragic $37,024 |
| Cree | 0.4 /100 | #268 | Tragic $37,018 |
| Immigrants | Venezuela | 0.4 /100 | #269 | Tragic $37,003 |
| French American Indians | 0.3 /100 | #270 | Tragic $36,920 |
| Nicaraguans | 0.3 /100 | #271 | Tragic $36,904 |
| Immigrants | Dominican Republic | 0.3 /100 | #272 | Tragic $36,857 |
| Immigrants | Laos | 0.3 /100 | #273 | Tragic $36,841 |
| Immigrants | El Salvador | 0.2 /100 | #274 | Tragic $36,673 |
| Africans | 0.1 /100 | #275 | Tragic $36,530 |
| Central Americans | 0.1 /100 | #276 | Tragic $36,492 |
| Marshallese | 0.1 /100 | #277 | Tragic $36,459 |
| U.S. Virgin Islanders | 0.1 /100 | #278 | Tragic $36,424 |
| Immigrants | Caribbean | 0.1 /100 | #279 | Tragic $36,414 |
| Iroquois | 0.1 /100 | #280 | Tragic $36,408 |
| Spanish Americans | 0.1 /100 | #281 | Tragic $36,391 |