Hawaiian vs Immigrants from El Salvador Median Female Earnings
COMPARE
Hawaiian
Immigrants from El Salvador
Median Female Earnings
Median Female Earnings Comparison
Hawaiians
Immigrants from El Salvador
$37,497
MEDIAN FEMALE EARNINGS
1.0/ 100
METRIC RATING
257th/ 347
METRIC RANK
$36,673
MEDIAN FEMALE EARNINGS
0.2/ 100
METRIC RATING
274th/ 347
METRIC RANK
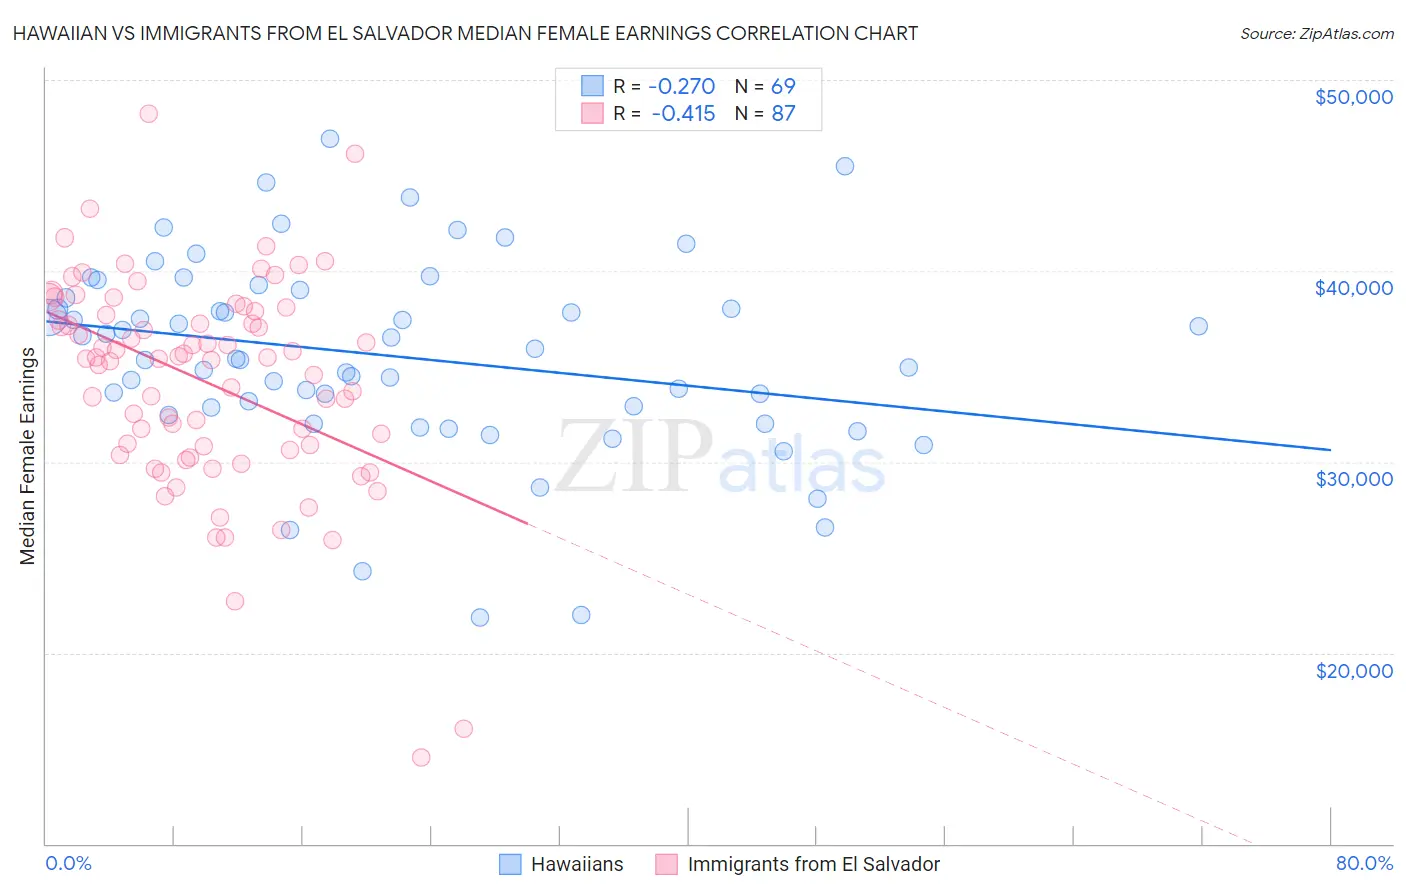
Hawaiian vs Immigrants from El Salvador Median Female Earnings Correlation Chart
The statistical analysis conducted on geographies consisting of 327,459,895 people shows a weak negative correlation between the proportion of Hawaiians and median female earnings in the United States with a correlation coefficient (R) of -0.270 and weighted average of $37,497. Similarly, the statistical analysis conducted on geographies consisting of 357,700,398 people shows a moderate negative correlation between the proportion of Immigrants from El Salvador and median female earnings in the United States with a correlation coefficient (R) of -0.415 and weighted average of $36,673, a difference of 2.2%.
Median Female Earnings Correlation Summary
| Measurement | Hawaiian | Immigrants from El Salvador |
| Minimum | $21,870 | $14,546 |
| Maximum | $46,893 | $48,246 |
| Range | $25,022 | $33,701 |
| Mean | $35,548 | $34,218 |
| Median | $35,373 | $35,415 |
| Interquartile 25% (IQ1) | $32,654 | $30,625 |
| Interquartile 75% (IQ3) | $38,788 | $37,872 |
| Interquartile Range (IQR) | $6,134 | $7,247 |
| Standard Deviation (Sample) | $5,103 | $5,551 |
| Standard Deviation (Population) | $5,066 | $5,519 |
Demographics Similar to Hawaiians and Immigrants from El Salvador by Median Female Earnings
In terms of median female earnings, the demographic groups most similar to Hawaiians are Samoan ($37,498, a difference of 0.0%), Colville ($37,514, a difference of 0.040%), Belizean ($37,429, a difference of 0.18%), Scotch-Irish ($37,383, a difference of 0.31%), and Dutch ($37,339, a difference of 0.42%). Similarly, the demographic groups most similar to Immigrants from El Salvador are African ($36,530, a difference of 0.39%), Immigrants from Laos ($36,841, a difference of 0.46%), Immigrants from Dominican Republic ($36,857, a difference of 0.50%), Nicaraguan ($36,904, a difference of 0.63%), and French American Indian ($36,920, a difference of 0.67%).
| Demographics | Rating | Rank | Median Female Earnings |
| Colville | 1.1 /100 | #255 | Tragic $37,514 |
| Samoans | 1.0 /100 | #256 | Tragic $37,498 |
| Hawaiians | 1.0 /100 | #257 | Tragic $37,497 |
| Belizeans | 0.9 /100 | #258 | Tragic $37,429 |
| Scotch-Irish | 0.8 /100 | #259 | Tragic $37,383 |
| Dutch | 0.7 /100 | #260 | Tragic $37,339 |
| Malaysians | 0.7 /100 | #261 | Tragic $37,298 |
| Venezuelans | 0.7 /100 | #262 | Tragic $37,282 |
| German Russians | 0.5 /100 | #263 | Tragic $37,105 |
| Salvadorans | 0.4 /100 | #264 | Tragic $37,083 |
| Immigrants | Belize | 0.4 /100 | #265 | Tragic $37,056 |
| Dominicans | 0.4 /100 | #266 | Tragic $37,046 |
| Immigrants | Nonimmigrants | 0.4 /100 | #267 | Tragic $37,024 |
| Cree | 0.4 /100 | #268 | Tragic $37,018 |
| Immigrants | Venezuela | 0.4 /100 | #269 | Tragic $37,003 |
| French American Indians | 0.3 /100 | #270 | Tragic $36,920 |
| Nicaraguans | 0.3 /100 | #271 | Tragic $36,904 |
| Immigrants | Dominican Republic | 0.3 /100 | #272 | Tragic $36,857 |
| Immigrants | Laos | 0.3 /100 | #273 | Tragic $36,841 |
| Immigrants | El Salvador | 0.2 /100 | #274 | Tragic $36,673 |
| Africans | 0.1 /100 | #275 | Tragic $36,530 |