Central American Indian vs Immigrants from El Salvador Median Female Earnings
COMPARE
Central American Indian
Immigrants from El Salvador
Median Female Earnings
Median Female Earnings Comparison
Central American Indians
Immigrants from El Salvador
$35,930
MEDIAN FEMALE EARNINGS
0.0/ 100
METRIC RATING
290th/ 347
METRIC RANK
$36,673
MEDIAN FEMALE EARNINGS
0.2/ 100
METRIC RATING
274th/ 347
METRIC RANK
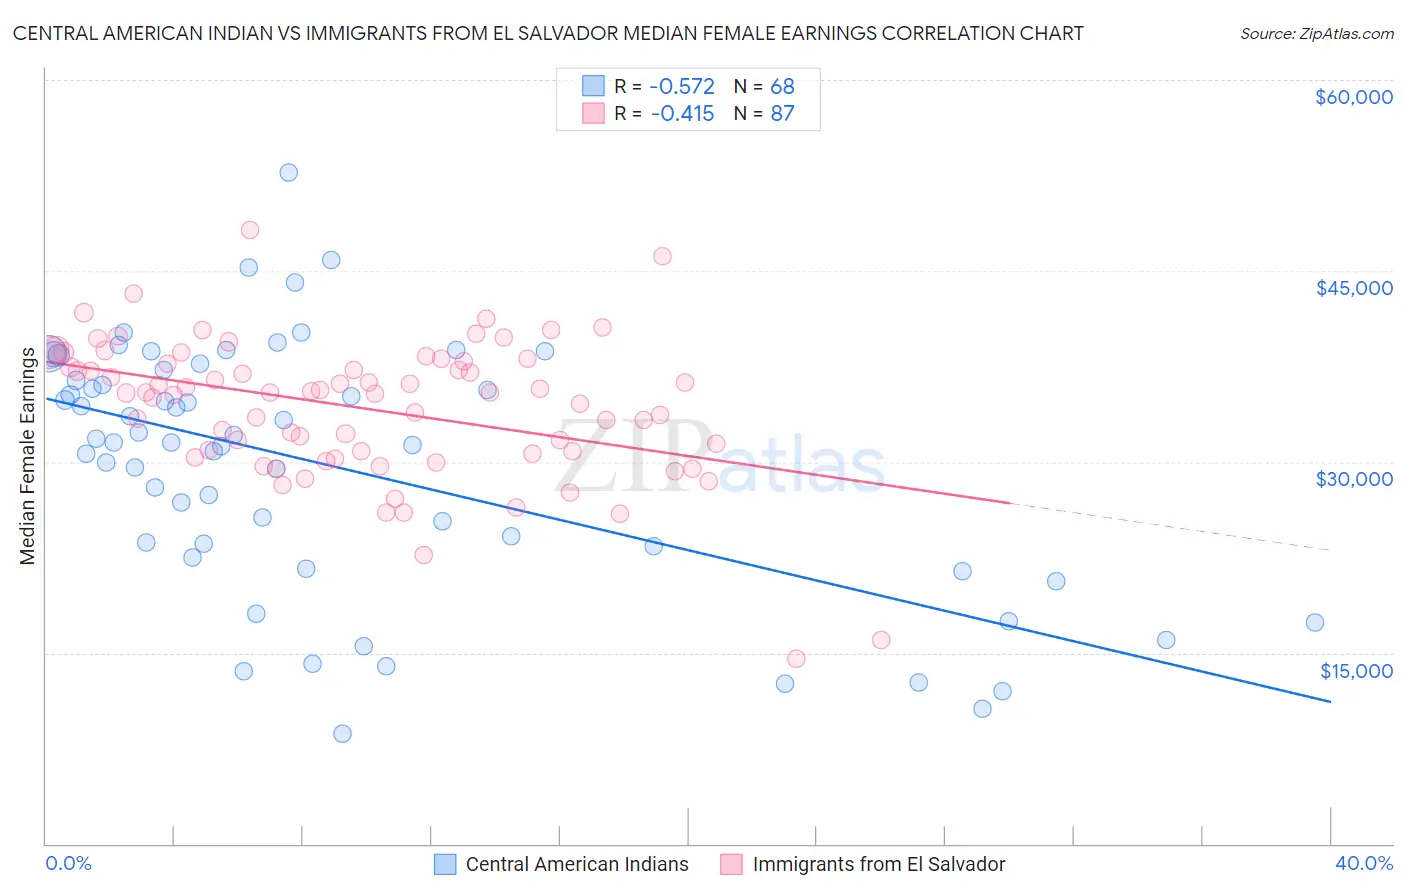
Central American Indian vs Immigrants from El Salvador Median Female Earnings Correlation Chart
The statistical analysis conducted on geographies consisting of 326,049,316 people shows a substantial negative correlation between the proportion of Central American Indians and median female earnings in the United States with a correlation coefficient (R) of -0.572 and weighted average of $35,930. Similarly, the statistical analysis conducted on geographies consisting of 357,700,398 people shows a moderate negative correlation between the proportion of Immigrants from El Salvador and median female earnings in the United States with a correlation coefficient (R) of -0.415 and weighted average of $36,673, a difference of 2.1%.
Median Female Earnings Correlation Summary
| Measurement | Central American Indian | Immigrants from El Salvador |
| Minimum | $8,640 | $14,546 |
| Maximum | $52,708 | $48,246 |
| Range | $44,068 | $33,701 |
| Mean | $29,634 | $34,218 |
| Median | $31,554 | $35,415 |
| Interquartile 25% (IQ1) | $22,964 | $30,625 |
| Interquartile 75% (IQ3) | $36,801 | $37,872 |
| Interquartile Range (IQR) | $13,837 | $7,247 |
| Standard Deviation (Sample) | $9,825 | $5,551 |
| Standard Deviation (Population) | $9,752 | $5,519 |
Demographics Similar to Central American Indians and Immigrants from El Salvador by Median Female Earnings
In terms of median female earnings, the demographic groups most similar to Central American Indians are Bangladeshi ($35,960, a difference of 0.080%), Blackfeet ($35,864, a difference of 0.18%), Immigrants from Zaire ($36,017, a difference of 0.24%), Immigrants from Nicaragua ($36,023, a difference of 0.26%), and Osage ($36,034, a difference of 0.29%). Similarly, the demographic groups most similar to Immigrants from El Salvador are African ($36,530, a difference of 0.39%), Immigrants from Laos ($36,841, a difference of 0.46%), Central American ($36,492, a difference of 0.49%), Immigrants from Dominican Republic ($36,857, a difference of 0.50%), and Marshallese ($36,459, a difference of 0.59%).
| Demographics | Rating | Rank | Median Female Earnings |
| Immigrants | Dominican Republic | 0.3 /100 | #272 | Tragic $36,857 |
| Immigrants | Laos | 0.3 /100 | #273 | Tragic $36,841 |
| Immigrants | El Salvador | 0.2 /100 | #274 | Tragic $36,673 |
| Africans | 0.1 /100 | #275 | Tragic $36,530 |
| Central Americans | 0.1 /100 | #276 | Tragic $36,492 |
| Marshallese | 0.1 /100 | #277 | Tragic $36,459 |
| U.S. Virgin Islanders | 0.1 /100 | #278 | Tragic $36,424 |
| Immigrants | Caribbean | 0.1 /100 | #279 | Tragic $36,414 |
| Iroquois | 0.1 /100 | #280 | Tragic $36,408 |
| Spanish Americans | 0.1 /100 | #281 | Tragic $36,391 |
| Haitians | 0.1 /100 | #282 | Tragic $36,374 |
| Immigrants | Haiti | 0.1 /100 | #283 | Tragic $36,203 |
| Indonesians | 0.1 /100 | #284 | Tragic $36,140 |
| Paiute | 0.1 /100 | #285 | Tragic $36,056 |
| Osage | 0.0 /100 | #286 | Tragic $36,034 |
| Immigrants | Nicaragua | 0.0 /100 | #287 | Tragic $36,023 |
| Immigrants | Zaire | 0.0 /100 | #288 | Tragic $36,017 |
| Bangladeshis | 0.0 /100 | #289 | Tragic $35,960 |
| Central American Indians | 0.0 /100 | #290 | Tragic $35,930 |
| Blackfeet | 0.0 /100 | #291 | Tragic $35,864 |
| Americans | 0.0 /100 | #292 | Tragic $35,777 |