Ethiopian vs Immigrants from Bahamas Median Female Earnings
COMPARE
Ethiopian
Immigrants from Bahamas
Median Female Earnings
Median Female Earnings Comparison
Ethiopians
Immigrants from Bahamas
$43,243
MEDIAN FEMALE EARNINGS
99.9/ 100
METRIC RATING
57th/ 347
METRIC RANK
$35,027
MEDIAN FEMALE EARNINGS
0.0/ 100
METRIC RATING
308th/ 347
METRIC RANK
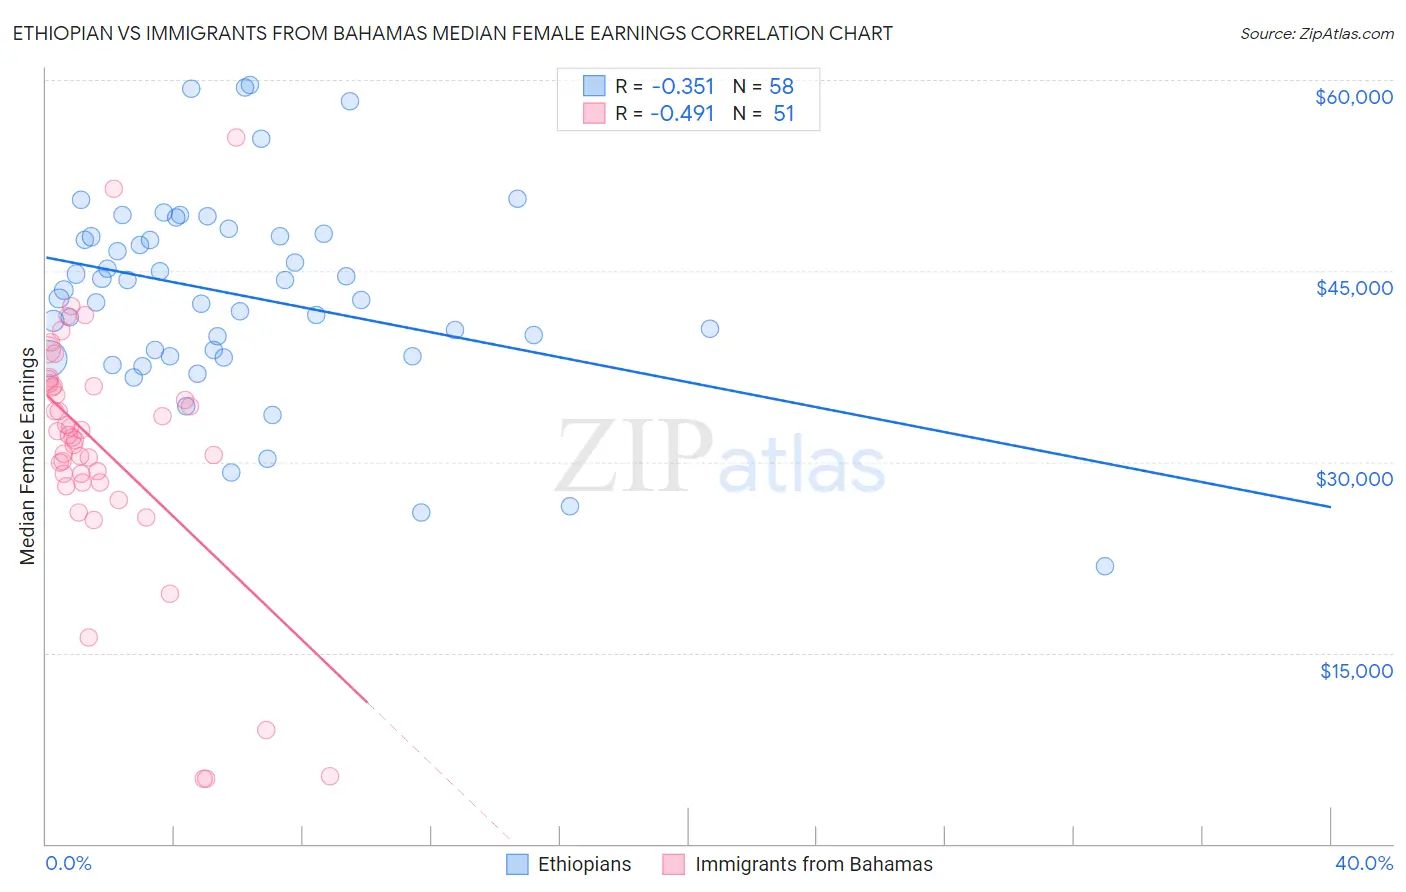
Ethiopian vs Immigrants from Bahamas Median Female Earnings Correlation Chart
The statistical analysis conducted on geographies consisting of 223,241,748 people shows a mild negative correlation between the proportion of Ethiopians and median female earnings in the United States with a correlation coefficient (R) of -0.351 and weighted average of $43,243. Similarly, the statistical analysis conducted on geographies consisting of 104,633,712 people shows a moderate negative correlation between the proportion of Immigrants from Bahamas and median female earnings in the United States with a correlation coefficient (R) of -0.491 and weighted average of $35,027, a difference of 23.5%.
Median Female Earnings Correlation Summary
| Measurement | Ethiopian | Immigrants from Bahamas |
| Minimum | $21,797 | $5,063 |
| Maximum | $59,585 | $55,500 |
| Range | $37,788 | $50,437 |
| Mean | $43,098 | $31,145 |
| Median | $43,184 | $32,119 |
| Interquartile 25% (IQ1) | $38,309 | $28,361 |
| Interquartile 75% (IQ3) | $47,681 | $35,940 |
| Interquartile Range (IQR) | $9,372 | $7,579 |
| Standard Deviation (Sample) | $7,882 | $9,851 |
| Standard Deviation (Population) | $7,814 | $9,754 |
Similar Demographics by Median Female Earnings
Demographics Similar to Ethiopians by Median Female Earnings
In terms of median female earnings, the demographic groups most similar to Ethiopians are Immigrants from Croatia ($43,258, a difference of 0.040%), Egyptian ($43,305, a difference of 0.14%), Immigrants from Eastern Europe ($43,309, a difference of 0.15%), Australian ($43,308, a difference of 0.15%), and Paraguayan ($43,173, a difference of 0.16%).
| Demographics | Rating | Rank | Median Female Earnings |
| Immigrants | Uzbekistan | 100.0 /100 | #50 | Exceptional $43,363 |
| Maltese | 100.0 /100 | #51 | Exceptional $43,357 |
| Immigrants | Lithuania | 99.9 /100 | #52 | Exceptional $43,317 |
| Immigrants | Eastern Europe | 99.9 /100 | #53 | Exceptional $43,309 |
| Australians | 99.9 /100 | #54 | Exceptional $43,308 |
| Egyptians | 99.9 /100 | #55 | Exceptional $43,305 |
| Immigrants | Croatia | 99.9 /100 | #56 | Exceptional $43,258 |
| Ethiopians | 99.9 /100 | #57 | Exceptional $43,243 |
| Paraguayans | 99.9 /100 | #58 | Exceptional $43,173 |
| Estonians | 99.9 /100 | #59 | Exceptional $43,106 |
| Immigrants | Latvia | 99.9 /100 | #60 | Exceptional $43,099 |
| Immigrants | Bulgaria | 99.9 /100 | #61 | Exceptional $43,085 |
| Afghans | 99.9 /100 | #62 | Exceptional $43,077 |
| Immigrants | Ukraine | 99.9 /100 | #63 | Exceptional $43,069 |
| Immigrants | Pakistan | 99.9 /100 | #64 | Exceptional $43,052 |
Demographics Similar to Immigrants from Bahamas by Median Female Earnings
In terms of median female earnings, the demographic groups most similar to Immigrants from Bahamas are Honduran ($35,013, a difference of 0.040%), Chippewa ($35,003, a difference of 0.070%), Sioux ($35,063, a difference of 0.10%), Ute ($34,960, a difference of 0.19%), and Yaqui ($34,943, a difference of 0.24%).
| Demographics | Rating | Rank | Median Female Earnings |
| Pima | 0.0 /100 | #301 | Tragic $35,326 |
| Blacks/African Americans | 0.0 /100 | #302 | Tragic $35,315 |
| Immigrants | Latin America | 0.0 /100 | #303 | Tragic $35,307 |
| Crow | 0.0 /100 | #304 | Tragic $35,266 |
| Bahamians | 0.0 /100 | #305 | Tragic $35,125 |
| Fijians | 0.0 /100 | #306 | Tragic $35,114 |
| Sioux | 0.0 /100 | #307 | Tragic $35,063 |
| Immigrants | Bahamas | 0.0 /100 | #308 | Tragic $35,027 |
| Hondurans | 0.0 /100 | #309 | Tragic $35,013 |
| Chippewa | 0.0 /100 | #310 | Tragic $35,003 |
| Ute | 0.0 /100 | #311 | Tragic $34,960 |
| Yaqui | 0.0 /100 | #312 | Tragic $34,943 |
| Cubans | 0.0 /100 | #313 | Tragic $34,942 |
| Apache | 0.0 /100 | #314 | Tragic $34,895 |
| Pennsylvania Germans | 0.0 /100 | #315 | Tragic $34,802 |