Paraguayan vs Immigrants from Bahamas Male Unemployment
COMPARE
Paraguayan
Immigrants from Bahamas
Male Unemployment
Male Unemployment Comparison
Paraguayans
Immigrants from Bahamas
4.9%
MALE UNEMPLOYMENT
99.5/ 100
METRIC RATING
35th/ 347
METRIC RANK
5.7%
MALE UNEMPLOYMENT
0.4/ 100
METRIC RATING
250th/ 347
METRIC RANK
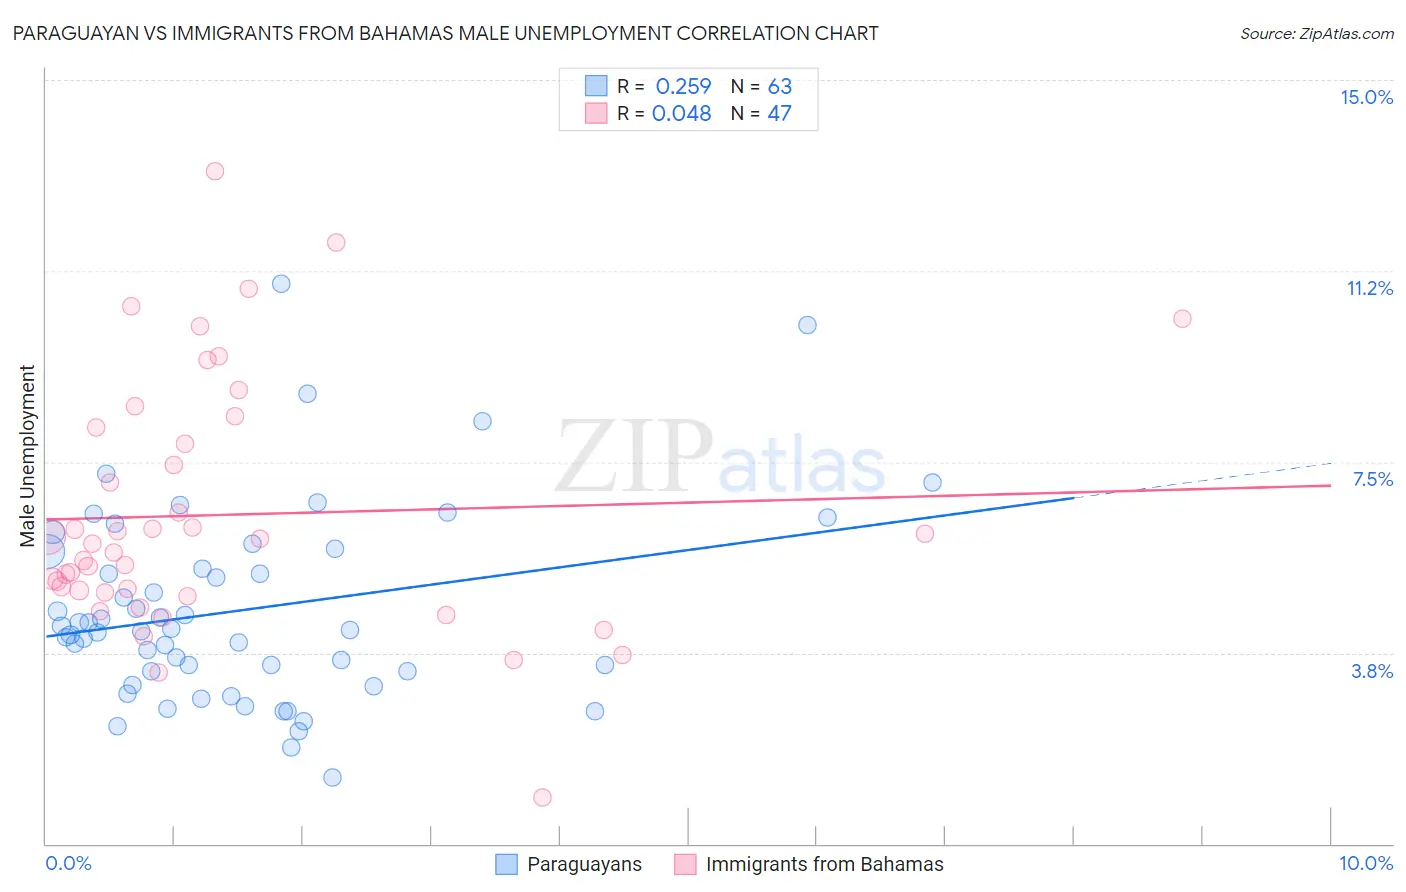
Paraguayan vs Immigrants from Bahamas Male Unemployment Correlation Chart
The statistical analysis conducted on geographies consisting of 95,072,234 people shows a weak positive correlation between the proportion of Paraguayans and unemployment rate among males in the United States with a correlation coefficient (R) of 0.259 and weighted average of 4.9%. Similarly, the statistical analysis conducted on geographies consisting of 104,587,349 people shows no correlation between the proportion of Immigrants from Bahamas and unemployment rate among males in the United States with a correlation coefficient (R) of 0.048 and weighted average of 5.7%, a difference of 17.2%.
Male Unemployment Correlation Summary
| Measurement | Paraguayan | Immigrants from Bahamas |
| Minimum | 1.3% | 0.90% |
| Maximum | 11.0% | 13.2% |
| Range | 9.7% | 12.3% |
| Mean | 4.6% | 6.5% |
| Median | 4.2% | 5.9% |
| Interquartile 25% (IQ1) | 3.4% | 4.9% |
| Interquartile 75% (IQ3) | 5.7% | 8.2% |
| Interquartile Range (IQR) | 2.3% | 3.2% |
| Standard Deviation (Sample) | 1.9% | 2.5% |
| Standard Deviation (Population) | 1.9% | 2.4% |
Similar Demographics by Male Unemployment
Demographics Similar to Paraguayans by Male Unemployment
In terms of male unemployment, the demographic groups most similar to Paraguayans are Immigrants from Singapore (4.9%, a difference of 0.080%), Scotch-Irish (4.9%, a difference of 0.29%), Immigrants from Bosnia and Herzegovina (4.9%, a difference of 0.31%), Burmese (4.9%, a difference of 0.38%), and Northern European (4.9%, a difference of 0.46%).
| Demographics | Rating | Rank | Male Unemployment |
| Bulgarians | 99.8 /100 | #28 | Exceptional 4.8% |
| Scottish | 99.8 /100 | #29 | Exceptional 4.8% |
| British | 99.8 /100 | #30 | Exceptional 4.8% |
| Sudanese | 99.8 /100 | #31 | Exceptional 4.8% |
| Immigrants | Nepal | 99.8 /100 | #32 | Exceptional 4.8% |
| Latvians | 99.7 /100 | #33 | Exceptional 4.8% |
| Welsh | 99.7 /100 | #34 | Exceptional 4.8% |
| Paraguayans | 99.5 /100 | #35 | Exceptional 4.9% |
| Immigrants | Singapore | 99.4 /100 | #36 | Exceptional 4.9% |
| Scotch-Irish | 99.4 /100 | #37 | Exceptional 4.9% |
| Immigrants | Bosnia and Herzegovina | 99.4 /100 | #38 | Exceptional 4.9% |
| Burmese | 99.3 /100 | #39 | Exceptional 4.9% |
| Northern Europeans | 99.3 /100 | #40 | Exceptional 4.9% |
| Chinese | 99.3 /100 | #41 | Exceptional 4.9% |
| Immigrants | Belgium | 99.2 /100 | #42 | Exceptional 4.9% |
Demographics Similar to Immigrants from Bahamas by Male Unemployment
In terms of male unemployment, the demographic groups most similar to Immigrants from Bahamas are Spanish American (5.7%, a difference of 0.040%), Cree (5.7%, a difference of 0.24%), Marshallese (5.7%, a difference of 0.31%), Mexican (5.8%, a difference of 0.62%), and Hawaiian (5.7%, a difference of 0.63%).
| Demographics | Rating | Rank | Male Unemployment |
| Bangladeshis | 0.8 /100 | #243 | Tragic 5.7% |
| Immigrants | El Salvador | 0.7 /100 | #244 | Tragic 5.7% |
| Yaqui | 0.7 /100 | #245 | Tragic 5.7% |
| Iroquois | 0.6 /100 | #246 | Tragic 5.7% |
| Hawaiians | 0.6 /100 | #247 | Tragic 5.7% |
| Marshallese | 0.5 /100 | #248 | Tragic 5.7% |
| Cree | 0.4 /100 | #249 | Tragic 5.7% |
| Immigrants | Bahamas | 0.4 /100 | #250 | Tragic 5.7% |
| Spanish Americans | 0.3 /100 | #251 | Tragic 5.7% |
| Mexicans | 0.2 /100 | #252 | Tragic 5.8% |
| Mexican American Indians | 0.2 /100 | #253 | Tragic 5.8% |
| Japanese | 0.2 /100 | #254 | Tragic 5.8% |
| Kiowa | 0.2 /100 | #255 | Tragic 5.8% |
| Comanche | 0.2 /100 | #256 | Tragic 5.8% |
| Hispanics or Latinos | 0.1 /100 | #257 | Tragic 5.8% |