Immigrants from Albania vs Immigrants from Bahamas Median Female Earnings
COMPARE
Immigrants from Albania
Immigrants from Bahamas
Median Female Earnings
Median Female Earnings Comparison
Immigrants from Albania
Immigrants from Bahamas
$42,388
MEDIAN FEMALE EARNINGS
99.6/ 100
METRIC RATING
77th/ 347
METRIC RANK
$35,027
MEDIAN FEMALE EARNINGS
0.0/ 100
METRIC RATING
308th/ 347
METRIC RANK
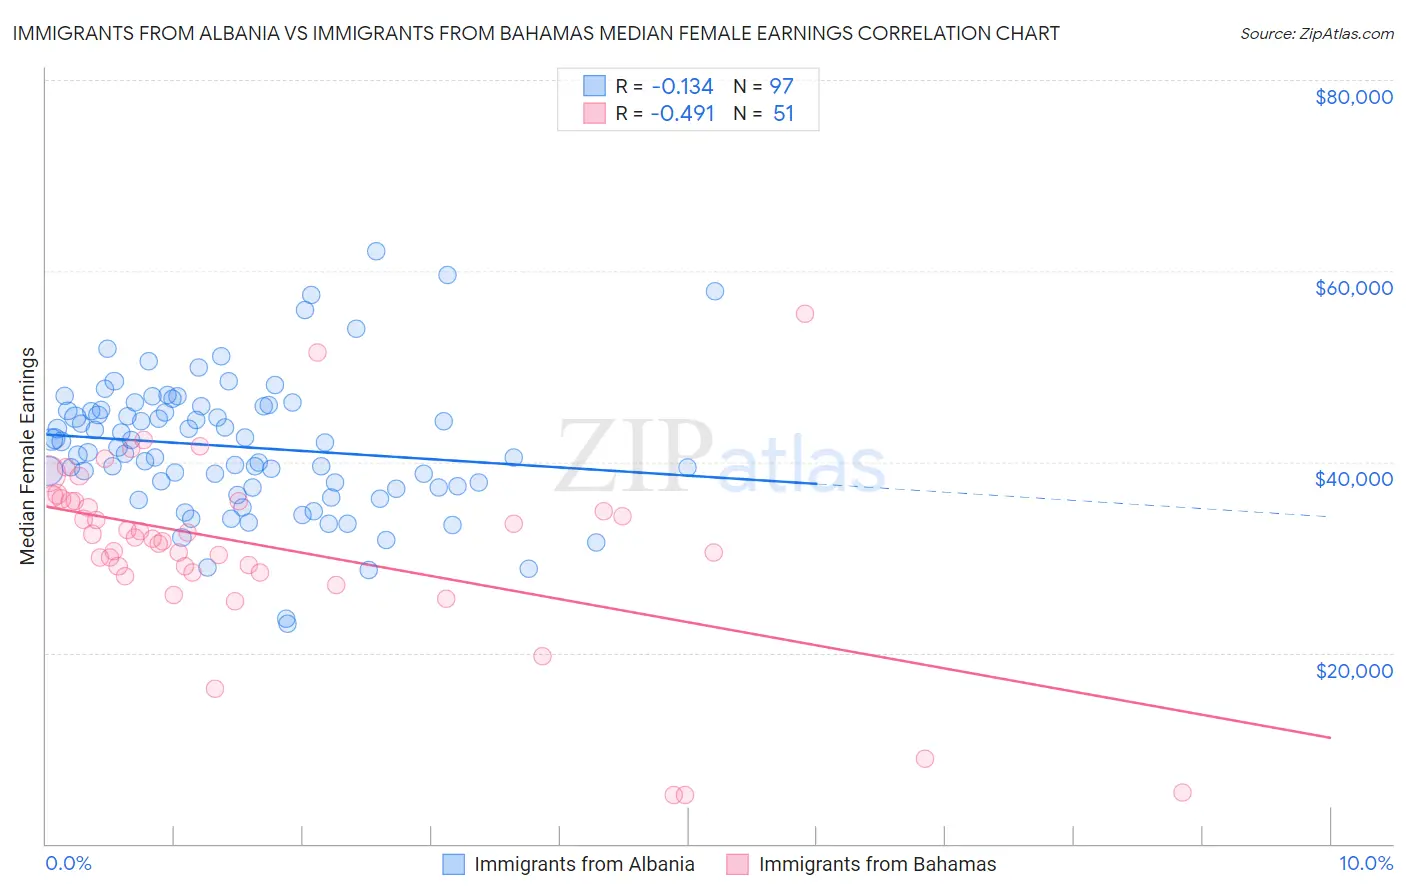
Immigrants from Albania vs Immigrants from Bahamas Median Female Earnings Correlation Chart
The statistical analysis conducted on geographies consisting of 119,358,863 people shows a poor negative correlation between the proportion of Immigrants from Albania and median female earnings in the United States with a correlation coefficient (R) of -0.134 and weighted average of $42,388. Similarly, the statistical analysis conducted on geographies consisting of 104,633,712 people shows a moderate negative correlation between the proportion of Immigrants from Bahamas and median female earnings in the United States with a correlation coefficient (R) of -0.491 and weighted average of $35,027, a difference of 21.0%.
Median Female Earnings Correlation Summary
| Measurement | Immigrants from Albania | Immigrants from Bahamas |
| Minimum | $23,074 | $5,063 |
| Maximum | $62,011 | $55,500 |
| Range | $38,937 | $50,437 |
| Mean | $41,579 | $31,145 |
| Median | $41,555 | $32,119 |
| Interquartile 25% (IQ1) | $37,330 | $28,361 |
| Interquartile 75% (IQ3) | $45,624 | $35,940 |
| Interquartile Range (IQR) | $8,295 | $7,579 |
| Standard Deviation (Sample) | $7,093 | $9,851 |
| Standard Deviation (Population) | $7,056 | $9,754 |
Similar Demographics by Median Female Earnings
Demographics Similar to Immigrants from Albania by Median Female Earnings
In terms of median female earnings, the demographic groups most similar to Immigrants from Albania are Immigrants from Kazakhstan ($42,386, a difference of 0.0%), Greek ($42,336, a difference of 0.12%), New Zealander ($42,446, a difference of 0.14%), Immigrants from Italy ($42,446, a difference of 0.14%), and Immigrants from Moldova ($42,304, a difference of 0.20%).
| Demographics | Rating | Rank | Median Female Earnings |
| Immigrants | Ethiopia | 99.8 /100 | #70 | Exceptional $42,744 |
| Immigrants | Romania | 99.8 /100 | #71 | Exceptional $42,718 |
| Albanians | 99.8 /100 | #72 | Exceptional $42,584 |
| Mongolians | 99.7 /100 | #73 | Exceptional $42,542 |
| Immigrants | South Africa | 99.7 /100 | #74 | Exceptional $42,508 |
| New Zealanders | 99.7 /100 | #75 | Exceptional $42,446 |
| Immigrants | Italy | 99.7 /100 | #76 | Exceptional $42,446 |
| Immigrants | Albania | 99.6 /100 | #77 | Exceptional $42,388 |
| Immigrants | Kazakhstan | 99.6 /100 | #78 | Exceptional $42,386 |
| Greeks | 99.6 /100 | #79 | Exceptional $42,336 |
| Immigrants | Moldova | 99.6 /100 | #80 | Exceptional $42,304 |
| Immigrants | Southern Europe | 99.5 /100 | #81 | Exceptional $42,275 |
| Immigrants | Morocco | 99.5 /100 | #82 | Exceptional $42,229 |
| Immigrants | Sierra Leone | 99.5 /100 | #83 | Exceptional $42,214 |
| Armenians | 99.5 /100 | #84 | Exceptional $42,212 |
Demographics Similar to Immigrants from Bahamas by Median Female Earnings
In terms of median female earnings, the demographic groups most similar to Immigrants from Bahamas are Honduran ($35,013, a difference of 0.040%), Chippewa ($35,003, a difference of 0.070%), Sioux ($35,063, a difference of 0.10%), Ute ($34,960, a difference of 0.19%), and Yaqui ($34,943, a difference of 0.24%).
| Demographics | Rating | Rank | Median Female Earnings |
| Pima | 0.0 /100 | #301 | Tragic $35,326 |
| Blacks/African Americans | 0.0 /100 | #302 | Tragic $35,315 |
| Immigrants | Latin America | 0.0 /100 | #303 | Tragic $35,307 |
| Crow | 0.0 /100 | #304 | Tragic $35,266 |
| Bahamians | 0.0 /100 | #305 | Tragic $35,125 |
| Fijians | 0.0 /100 | #306 | Tragic $35,114 |
| Sioux | 0.0 /100 | #307 | Tragic $35,063 |
| Immigrants | Bahamas | 0.0 /100 | #308 | Tragic $35,027 |
| Hondurans | 0.0 /100 | #309 | Tragic $35,013 |
| Chippewa | 0.0 /100 | #310 | Tragic $35,003 |
| Ute | 0.0 /100 | #311 | Tragic $34,960 |
| Yaqui | 0.0 /100 | #312 | Tragic $34,943 |
| Cubans | 0.0 /100 | #313 | Tragic $34,942 |
| Apache | 0.0 /100 | #314 | Tragic $34,895 |
| Pennsylvania Germans | 0.0 /100 | #315 | Tragic $34,802 |