Paraguayan vs Immigrants from Bahamas Disability
COMPARE
Paraguayan
Immigrants from Bahamas
Disability
Disability Comparison
Paraguayans
Immigrants from Bahamas
10.6%
DISABILITY
100.0/ 100
METRIC RATING
32nd/ 347
METRIC RANK
12.1%
DISABILITY
4.7/ 100
METRIC RATING
220th/ 347
METRIC RANK
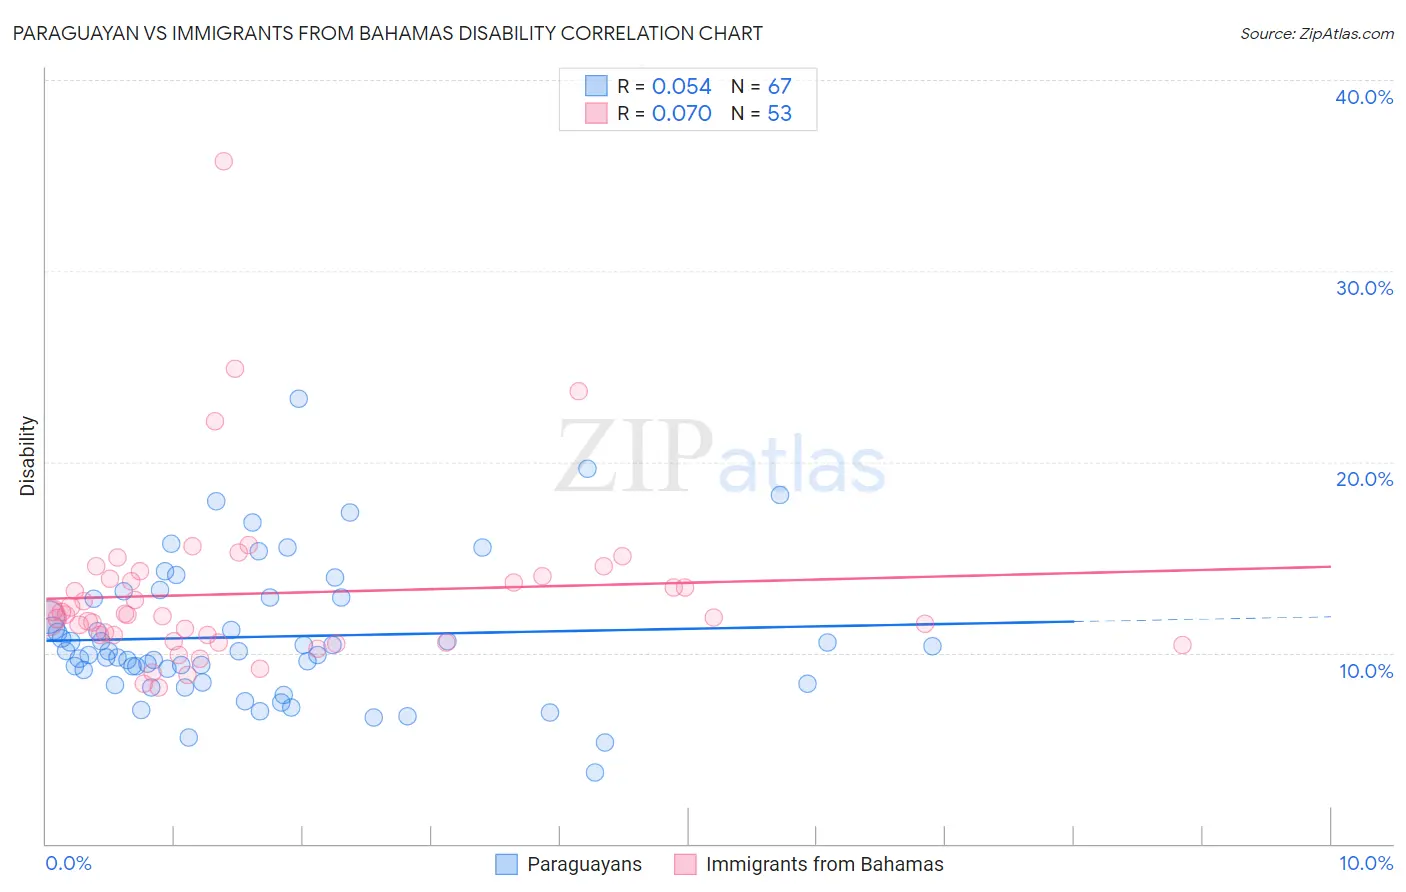
Paraguayan vs Immigrants from Bahamas Disability Correlation Chart
The statistical analysis conducted on geographies consisting of 95,111,700 people shows a slight positive correlation between the proportion of Paraguayans and percentage of population with a disability in the United States with a correlation coefficient (R) of 0.054 and weighted average of 10.6%. Similarly, the statistical analysis conducted on geographies consisting of 104,655,290 people shows a slight positive correlation between the proportion of Immigrants from Bahamas and percentage of population with a disability in the United States with a correlation coefficient (R) of 0.070 and weighted average of 12.1%, a difference of 13.5%.
Disability Correlation Summary
| Measurement | Paraguayan | Immigrants from Bahamas |
| Minimum | 3.7% | 8.2% |
| Maximum | 23.3% | 35.8% |
| Range | 19.6% | 27.6% |
| Mean | 10.8% | 13.1% |
| Median | 10.1% | 12.0% |
| Interquartile 25% (IQ1) | 8.5% | 10.8% |
| Interquartile 75% (IQ3) | 12.9% | 14.0% |
| Interquartile Range (IQR) | 4.4% | 3.2% |
| Standard Deviation (Sample) | 3.6% | 4.6% |
| Standard Deviation (Population) | 3.6% | 4.5% |
Similar Demographics by Disability
Demographics Similar to Paraguayans by Disability
In terms of disability, the demographic groups most similar to Paraguayans are Immigrants from Egypt (10.6%, a difference of 0.10%), Immigrants from Turkey (10.6%, a difference of 0.17%), Immigrants from Kuwait (10.7%, a difference of 0.25%), Immigrants from Argentina (10.6%, a difference of 0.33%), and Egyptian (10.6%, a difference of 0.46%).
| Demographics | Rating | Rank | Disability |
| Immigrants | Malaysia | 100.0 /100 | #25 | Exceptional 10.6% |
| Argentineans | 100.0 /100 | #26 | Exceptional 10.6% |
| Cypriots | 100.0 /100 | #27 | Exceptional 10.6% |
| Egyptians | 100.0 /100 | #28 | Exceptional 10.6% |
| Immigrants | Argentina | 100.0 /100 | #29 | Exceptional 10.6% |
| Immigrants | Turkey | 100.0 /100 | #30 | Exceptional 10.6% |
| Immigrants | Egypt | 100.0 /100 | #31 | Exceptional 10.6% |
| Paraguayans | 100.0 /100 | #32 | Exceptional 10.6% |
| Immigrants | Kuwait | 100.0 /100 | #33 | Exceptional 10.7% |
| Immigrants | Ethiopia | 100.0 /100 | #34 | Exceptional 10.7% |
| Immigrants | Indonesia | 100.0 /100 | #35 | Exceptional 10.7% |
| Ethiopians | 100.0 /100 | #36 | Exceptional 10.7% |
| Turks | 100.0 /100 | #37 | Exceptional 10.7% |
| Afghans | 99.9 /100 | #38 | Exceptional 10.8% |
| Cambodians | 99.9 /100 | #39 | Exceptional 10.8% |
Demographics Similar to Immigrants from Bahamas by Disability
In terms of disability, the demographic groups most similar to Immigrants from Bahamas are Croatian (12.1%, a difference of 0.040%), Immigrants from Jamaica (12.1%, a difference of 0.080%), Northern European (12.1%, a difference of 0.12%), Immigrants from North America (12.1%, a difference of 0.15%), and Panamanian (12.1%, a difference of 0.16%).
| Demographics | Rating | Rank | Disability |
| Immigrants | Iraq | 7.1 /100 | #213 | Tragic 12.0% |
| Immigrants | Somalia | 6.8 /100 | #214 | Tragic 12.0% |
| Immigrants | Canada | 6.1 /100 | #215 | Tragic 12.1% |
| Panamanians | 5.4 /100 | #216 | Tragic 12.1% |
| Immigrants | North America | 5.3 /100 | #217 | Tragic 12.1% |
| Immigrants | Jamaica | 5.0 /100 | #218 | Tragic 12.1% |
| Croatians | 4.9 /100 | #219 | Tragic 12.1% |
| Immigrants | Bahamas | 4.7 /100 | #220 | Tragic 12.1% |
| Northern Europeans | 4.2 /100 | #221 | Tragic 12.1% |
| Spanish American Indians | 4.1 /100 | #222 | Tragic 12.1% |
| Hispanics or Latinos | 3.9 /100 | #223 | Tragic 12.1% |
| Mexicans | 3.7 /100 | #224 | Tragic 12.1% |
| Senegalese | 3.5 /100 | #225 | Tragic 12.1% |
| Jamaicans | 3.3 /100 | #226 | Tragic 12.1% |
| Alsatians | 3.3 /100 | #227 | Tragic 12.1% |