Panamanian vs Immigrants from France In Labor Force | Age 30-34
COMPARE
Panamanian
Immigrants from France
In Labor Force | Age 30-34
In Labor Force | Age 30-34 Comparison
Panamanians
Immigrants from France
84.2%
IN LABOR FORCE | AGE 30-34
3.8/ 100
METRIC RATING
222nd/ 347
METRIC RANK
85.5%
IN LABOR FORCE | AGE 30-34
99.5/ 100
METRIC RATING
60th/ 347
METRIC RANK
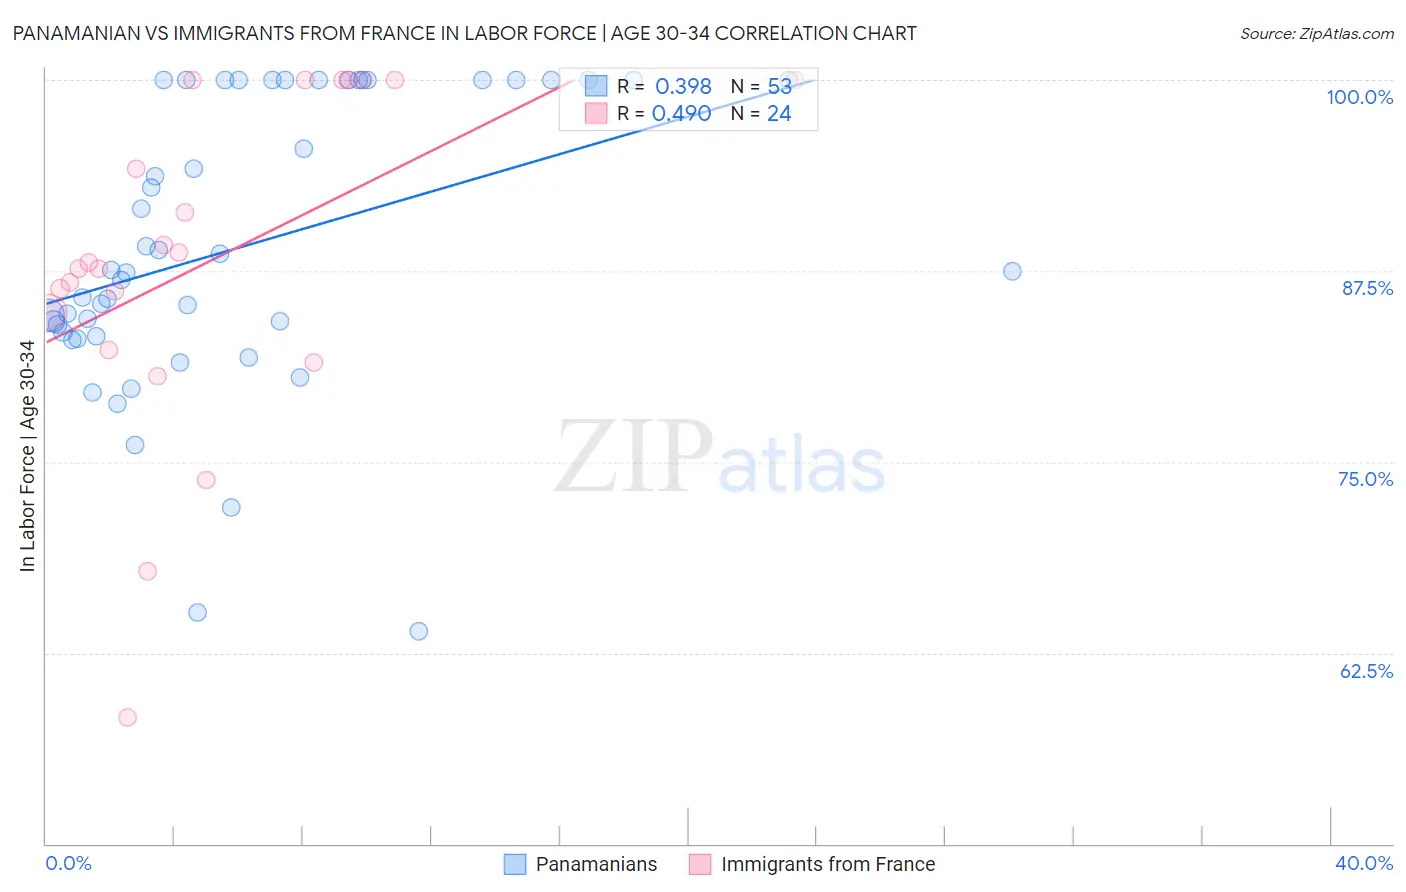
Panamanian vs Immigrants from France In Labor Force | Age 30-34 Correlation Chart
The statistical analysis conducted on geographies consisting of 281,117,807 people shows a mild positive correlation between the proportion of Panamanians and labor force participation rate among population between the ages 30 and 34 in the United States with a correlation coefficient (R) of 0.398 and weighted average of 84.2%. Similarly, the statistical analysis conducted on geographies consisting of 287,830,684 people shows a moderate positive correlation between the proportion of Immigrants from France and labor force participation rate among population between the ages 30 and 34 in the United States with a correlation coefficient (R) of 0.490 and weighted average of 85.5%, a difference of 1.5%.
In Labor Force | Age 30-34 Correlation Summary
| Measurement | Panamanian | Immigrants from France |
| Minimum | 63.9% | 58.2% |
| Maximum | 100.0% | 100.0% |
| Range | 36.1% | 41.8% |
| Mean | 89.1% | 88.1% |
| Median | 87.5% | 87.9% |
| Interquartile 25% (IQ1) | 83.4% | 83.6% |
| Interquartile 75% (IQ3) | 100.0% | 100.0% |
| Interquartile Range (IQR) | 16.6% | 16.4% |
| Standard Deviation (Sample) | 9.4% | 10.8% |
| Standard Deviation (Population) | 9.3% | 10.6% |
Similar Demographics by In Labor Force | Age 30-34
Demographics Similar to Panamanians by In Labor Force | Age 30-34
In terms of in labor force | age 30-34, the demographic groups most similar to Panamanians are Salvadoran (84.2%, a difference of 0.0%), Immigrants from Laos (84.2%, a difference of 0.010%), Cuban (84.2%, a difference of 0.020%), Scottish (84.2%, a difference of 0.040%), and Immigrants from El Salvador (84.2%, a difference of 0.040%).
| Demographics | Rating | Rank | In Labor Force | Age 30-34 |
| Europeans | 7.2 /100 | #215 | Tragic 84.3% |
| Immigrants | Ecuador | 7.1 /100 | #216 | Tragic 84.3% |
| Immigrants | Trinidad and Tobago | 7.0 /100 | #217 | Tragic 84.3% |
| Immigrants | Panama | 6.3 /100 | #218 | Tragic 84.3% |
| Swiss | 5.8 /100 | #219 | Tragic 84.3% |
| Danes | 5.3 /100 | #220 | Tragic 84.3% |
| Salvadorans | 3.8 /100 | #221 | Tragic 84.2% |
| Panamanians | 3.8 /100 | #222 | Tragic 84.2% |
| Immigrants | Laos | 3.6 /100 | #223 | Tragic 84.2% |
| Cubans | 3.4 /100 | #224 | Tragic 84.2% |
| Scottish | 3.1 /100 | #225 | Tragic 84.2% |
| Immigrants | El Salvador | 3.0 /100 | #226 | Tragic 84.2% |
| Immigrants | Cuba | 3.0 /100 | #227 | Tragic 84.2% |
| Immigrants | Haiti | 2.8 /100 | #228 | Tragic 84.2% |
| Welsh | 2.7 /100 | #229 | Tragic 84.2% |
Demographics Similar to Immigrants from France by In Labor Force | Age 30-34
In terms of in labor force | age 30-34, the demographic groups most similar to Immigrants from France are Immigrants from Brazil (85.5%, a difference of 0.0%), Soviet Union (85.5%, a difference of 0.010%), Macedonian (85.5%, a difference of 0.010%), Immigrants from Poland (85.5%, a difference of 0.020%), and Italian (85.4%, a difference of 0.020%).
| Demographics | Rating | Rank | In Labor Force | Age 30-34 |
| Filipinos | 99.6 /100 | #53 | Exceptional 85.5% |
| Immigrants | Kenya | 99.6 /100 | #54 | Exceptional 85.5% |
| Immigrants | Turkey | 99.6 /100 | #55 | Exceptional 85.5% |
| Czechs | 99.6 /100 | #56 | Exceptional 85.5% |
| Russians | 99.6 /100 | #57 | Exceptional 85.5% |
| Poles | 99.6 /100 | #58 | Exceptional 85.5% |
| Immigrants | Poland | 99.5 /100 | #59 | Exceptional 85.5% |
| Immigrants | France | 99.5 /100 | #60 | Exceptional 85.5% |
| Immigrants | Brazil | 99.5 /100 | #61 | Exceptional 85.5% |
| Soviet Union | 99.4 /100 | #62 | Exceptional 85.5% |
| Macedonians | 99.4 /100 | #63 | Exceptional 85.5% |
| Italians | 99.4 /100 | #64 | Exceptional 85.4% |
| Senegalese | 99.4 /100 | #65 | Exceptional 85.4% |
| Ghanaians | 99.4 /100 | #66 | Exceptional 85.4% |
| Kenyans | 99.3 /100 | #67 | Exceptional 85.4% |