Panamanian vs Immigrants from France Male Unemployment
COMPARE
Panamanian
Immigrants from France
Male Unemployment
Male Unemployment Comparison
Panamanians
Immigrants from France
5.6%
MALE UNEMPLOYMENT
1.9/ 100
METRIC RATING
225th/ 347
METRIC RANK
5.1%
MALE UNEMPLOYMENT
92.7/ 100
METRIC RATING
102nd/ 347
METRIC RANK
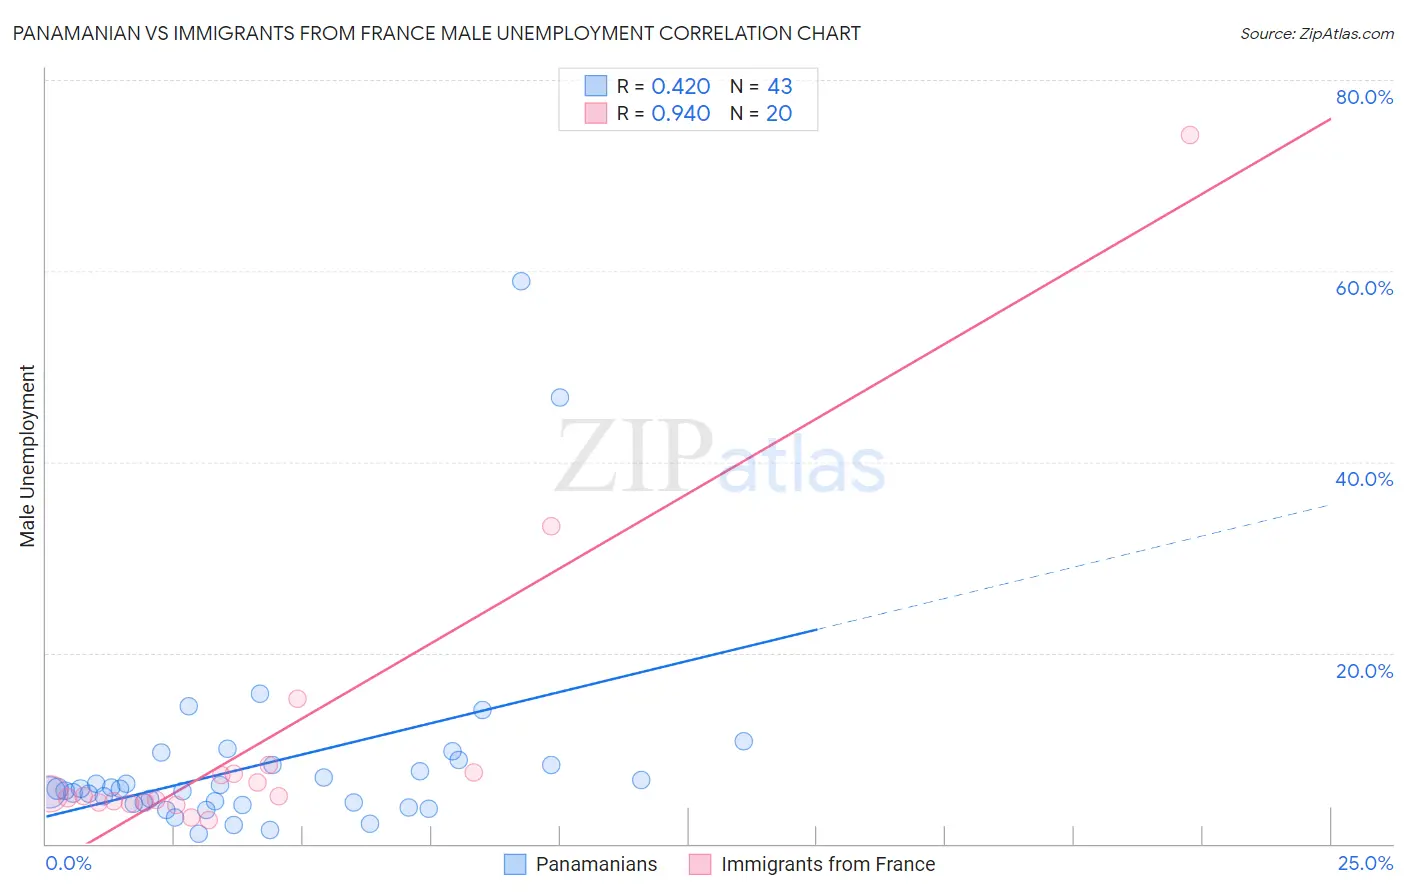
Panamanian vs Immigrants from France Male Unemployment Correlation Chart
The statistical analysis conducted on geographies consisting of 280,561,708 people shows a moderate positive correlation between the proportion of Panamanians and unemployment rate among males in the United States with a correlation coefficient (R) of 0.420 and weighted average of 5.6%. Similarly, the statistical analysis conducted on geographies consisting of 287,192,978 people shows a near-perfect positive correlation between the proportion of Immigrants from France and unemployment rate among males in the United States with a correlation coefficient (R) of 0.940 and weighted average of 5.1%, a difference of 9.8%.
Male Unemployment Correlation Summary
| Measurement | Panamanian | Immigrants from France |
| Minimum | 1.0% | 2.5% |
| Maximum | 58.9% | 74.2% |
| Range | 57.9% | 71.7% |
| Mean | 8.4% | 10.5% |
| Median | 5.8% | 5.0% |
| Interquartile 25% (IQ1) | 4.2% | 4.3% |
| Interquartile 75% (IQ3) | 8.3% | 7.4% |
| Interquartile Range (IQR) | 4.1% | 3.1% |
| Standard Deviation (Sample) | 10.5% | 16.4% |
| Standard Deviation (Population) | 10.4% | 16.0% |
Similar Demographics by Male Unemployment
Demographics Similar to Panamanians by Male Unemployment
In terms of male unemployment, the demographic groups most similar to Panamanians are Immigrants from Cambodia (5.6%, a difference of 0.090%), Immigrants from Panama (5.6%, a difference of 0.090%), Seminole (5.6%, a difference of 0.11%), Central American (5.6%, a difference of 0.11%), and Immigrants from Africa (5.6%, a difference of 0.15%).
| Demographics | Rating | Rank | Male Unemployment |
| Immigrants | Albania | 3.6 /100 | #218 | Tragic 5.5% |
| Immigrants | Western Asia | 3.5 /100 | #219 | Tragic 5.6% |
| Portuguese | 3.5 /100 | #220 | Tragic 5.6% |
| Soviet Union | 3.2 /100 | #221 | Tragic 5.6% |
| Immigrants | Micronesia | 2.9 /100 | #222 | Tragic 5.6% |
| Creek | 2.6 /100 | #223 | Tragic 5.6% |
| Cherokee | 2.4 /100 | #224 | Tragic 5.6% |
| Panamanians | 1.9 /100 | #225 | Tragic 5.6% |
| Immigrants | Cambodia | 1.8 /100 | #226 | Tragic 5.6% |
| Immigrants | Panama | 1.8 /100 | #227 | Tragic 5.6% |
| Seminole | 1.8 /100 | #228 | Tragic 5.6% |
| Central Americans | 1.8 /100 | #229 | Tragic 5.6% |
| Immigrants | Africa | 1.7 /100 | #230 | Tragic 5.6% |
| Choctaw | 1.6 /100 | #231 | Tragic 5.6% |
| Moroccans | 1.6 /100 | #232 | Tragic 5.6% |
Demographics Similar to Immigrants from France by Male Unemployment
In terms of male unemployment, the demographic groups most similar to Immigrants from France are German Russian (5.1%, a difference of 0.020%), Russian (5.1%, a difference of 0.060%), Uruguayan (5.1%, a difference of 0.070%), Immigrants from Kuwait (5.1%, a difference of 0.14%), and Immigrants from Jordan (5.1%, a difference of 0.16%).
| Demographics | Rating | Rank | Male Unemployment |
| Italians | 93.8 /100 | #95 | Exceptional 5.1% |
| Asians | 93.7 /100 | #96 | Exceptional 5.1% |
| Immigrants | Spain | 93.4 /100 | #97 | Exceptional 5.1% |
| Immigrants | Kuwait | 93.3 /100 | #98 | Exceptional 5.1% |
| Uruguayans | 93.0 /100 | #99 | Exceptional 5.1% |
| Russians | 92.9 /100 | #100 | Exceptional 5.1% |
| German Russians | 92.7 /100 | #101 | Exceptional 5.1% |
| Immigrants | France | 92.7 /100 | #102 | Exceptional 5.1% |
| Immigrants | Jordan | 91.9 /100 | #103 | Exceptional 5.1% |
| Immigrants | Chile | 91.8 /100 | #104 | Exceptional 5.1% |
| Immigrants | Czechoslovakia | 91.7 /100 | #105 | Exceptional 5.1% |
| Immigrants | Ethiopia | 91.5 /100 | #106 | Exceptional 5.1% |
| Ethiopians | 91.3 /100 | #107 | Exceptional 5.1% |
| Immigrants | Nicaragua | 91.2 /100 | #108 | Exceptional 5.1% |
| Immigrants | Pakistan | 90.9 /100 | #109 | Exceptional 5.1% |