Palestinian vs Guyanese Wage/Income Gap
COMPARE
Palestinian
Guyanese
Wage/Income Gap
Wage/Income Gap Comparison
Palestinians
Guyanese
26.1%
WAGE/INCOME GAP
29.9/ 100
METRIC RATING
187th/ 347
METRIC RANK
18.3%
WAGE/INCOME GAP
100.0/ 100
METRIC RATING
5th/ 347
METRIC RANK
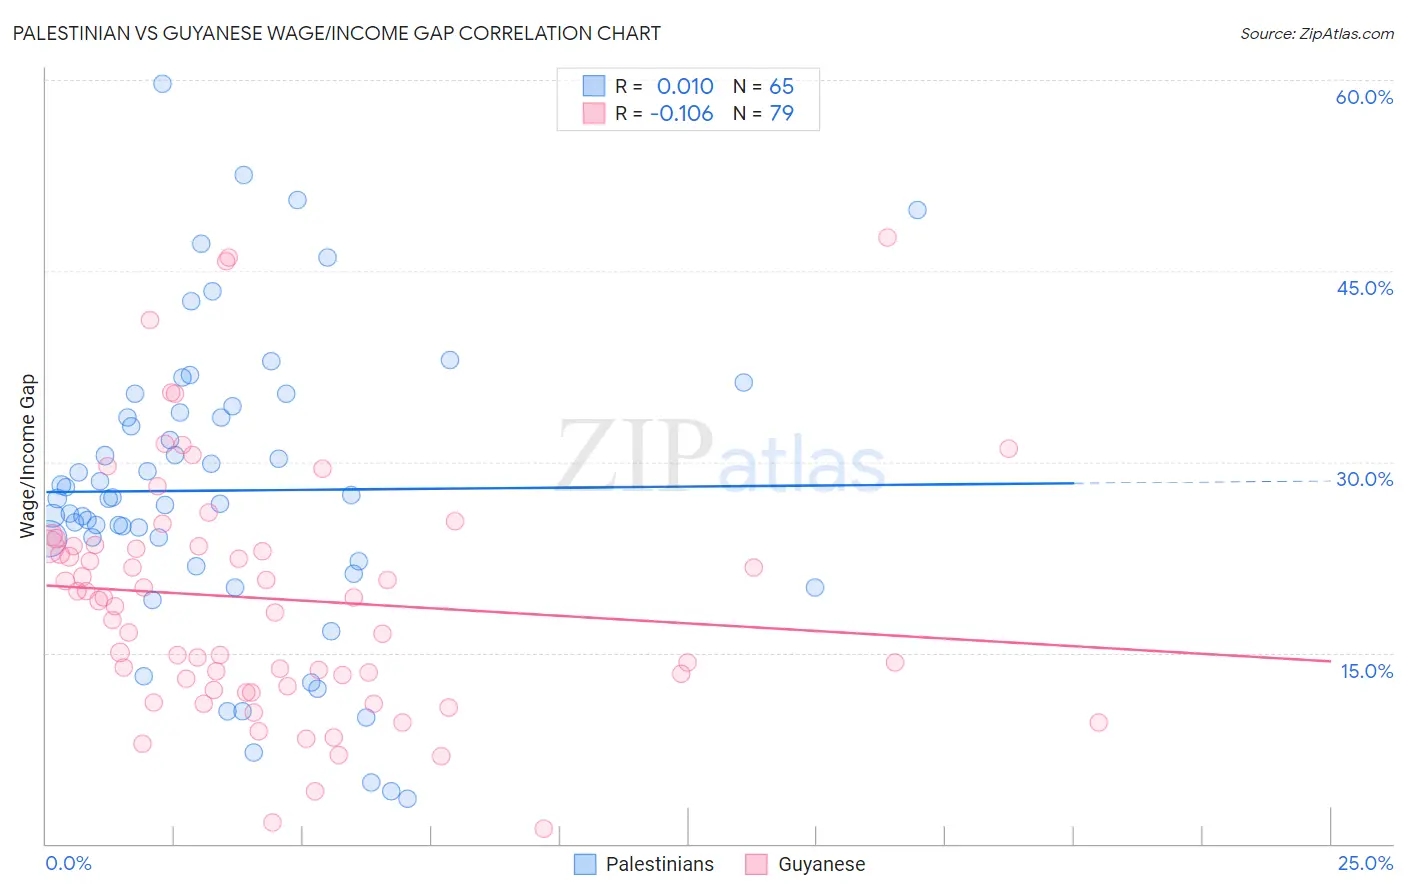
Palestinian vs Guyanese Wage/Income Gap Correlation Chart
The statistical analysis conducted on geographies consisting of 216,443,706 people shows no correlation between the proportion of Palestinians and wage/income gap percentage in the United States with a correlation coefficient (R) of 0.010 and weighted average of 26.1%. Similarly, the statistical analysis conducted on geographies consisting of 176,905,997 people shows a poor negative correlation between the proportion of Guyanese and wage/income gap percentage in the United States with a correlation coefficient (R) of -0.106 and weighted average of 18.3%, a difference of 42.7%.
Wage/Income Gap Correlation Summary
| Measurement | Palestinian | Guyanese |
| Minimum | 3.6% | 1.1% |
| Maximum | 59.7% | 47.7% |
| Range | 56.1% | 46.5% |
| Mean | 27.8% | 19.2% |
| Median | 27.1% | 19.1% |
| Interquartile 25% (IQ1) | 22.0% | 12.4% |
| Interquartile 75% (IQ3) | 34.1% | 23.4% |
| Interquartile Range (IQR) | 12.1% | 11.0% |
| Standard Deviation (Sample) | 11.7% | 9.6% |
| Standard Deviation (Population) | 11.6% | 9.6% |
Similar Demographics by Wage/Income Gap
Demographics Similar to Palestinians by Wage/Income Gap
In terms of wage/income gap, the demographic groups most similar to Palestinians are Immigrants from Egypt (26.1%, a difference of 0.010%), Immigrants from Indonesia (26.1%, a difference of 0.19%), Immigrants from Moldova (26.2%, a difference of 0.26%), Pakistani (26.1%, a difference of 0.28%), and Mexican (26.0%, a difference of 0.33%).
| Demographics | Rating | Rank | Wage/Income Gap |
| Guamanians/Chamorros | 38.0 /100 | #180 | Fair 26.0% |
| Immigrants | Bolivia | 36.4 /100 | #181 | Fair 26.0% |
| Immigrants | Serbia | 35.4 /100 | #182 | Fair 26.0% |
| Immigrants | Kazakhstan | 35.2 /100 | #183 | Fair 26.0% |
| Mexicans | 34.4 /100 | #184 | Fair 26.0% |
| Pakistanis | 33.7 /100 | #185 | Fair 26.1% |
| Immigrants | Indonesia | 32.5 /100 | #186 | Fair 26.1% |
| Palestinians | 29.9 /100 | #187 | Fair 26.1% |
| Immigrants | Egypt | 29.9 /100 | #188 | Fair 26.1% |
| Immigrants | Moldova | 26.6 /100 | #189 | Fair 26.2% |
| Immigrants | Croatia | 24.8 /100 | #190 | Fair 26.2% |
| Immigrants | Venezuela | 24.7 /100 | #191 | Fair 26.2% |
| Immigrants | Bulgaria | 22.5 /100 | #192 | Fair 26.3% |
| Immigrants | Jordan | 22.4 /100 | #193 | Fair 26.3% |
| Chileans | 22.3 /100 | #194 | Fair 26.3% |
Demographics Similar to Guyanese by Wage/Income Gap
In terms of wage/income gap, the demographic groups most similar to Guyanese are Immigrants from Guyana (18.4%, a difference of 0.26%), British West Indian (18.0%, a difference of 1.6%), Puerto Rican (18.7%, a difference of 2.3%), Immigrants from Barbados (17.8%, a difference of 2.6%), and Immigrants from Jamaica (18.8%, a difference of 2.9%).
| Demographics | Rating | Rank | Wage/Income Gap |
| Immigrants | Grenada | 100.0 /100 | #1 | Exceptional 16.2% |
| Immigrants | St. Vincent and the Grenadines | 100.0 /100 | #2 | Exceptional 16.4% |
| Immigrants | Barbados | 100.0 /100 | #3 | Exceptional 17.8% |
| British West Indians | 100.0 /100 | #4 | Exceptional 18.0% |
| Guyanese | 100.0 /100 | #5 | Exceptional 18.3% |
| Immigrants | Guyana | 100.0 /100 | #6 | Exceptional 18.4% |
| Puerto Ricans | 100.0 /100 | #7 | Exceptional 18.7% |
| Immigrants | Jamaica | 100.0 /100 | #8 | Exceptional 18.8% |
| Barbadians | 100.0 /100 | #9 | Exceptional 19.0% |
| Crow | 100.0 /100 | #10 | Exceptional 19.1% |
| Immigrants | Haiti | 100.0 /100 | #11 | Exceptional 19.2% |
| Immigrants | West Indies | 100.0 /100 | #12 | Exceptional 19.2% |
| Trinidadians and Tobagonians | 100.0 /100 | #13 | Exceptional 19.3% |
| Immigrants | Trinidad and Tobago | 100.0 /100 | #14 | Exceptional 19.3% |
| West Indians | 100.0 /100 | #15 | Exceptional 19.6% |