Palestinian vs Luxembourger Wage/Income Gap
COMPARE
Palestinian
Luxembourger
Wage/Income Gap
Wage/Income Gap Comparison
Palestinians
Luxembourgers
26.1%
WAGE/INCOME GAP
29.9/ 100
METRIC RATING
187th/ 347
METRIC RANK
27.4%
WAGE/INCOME GAP
1.9/ 100
METRIC RATING
257th/ 347
METRIC RANK
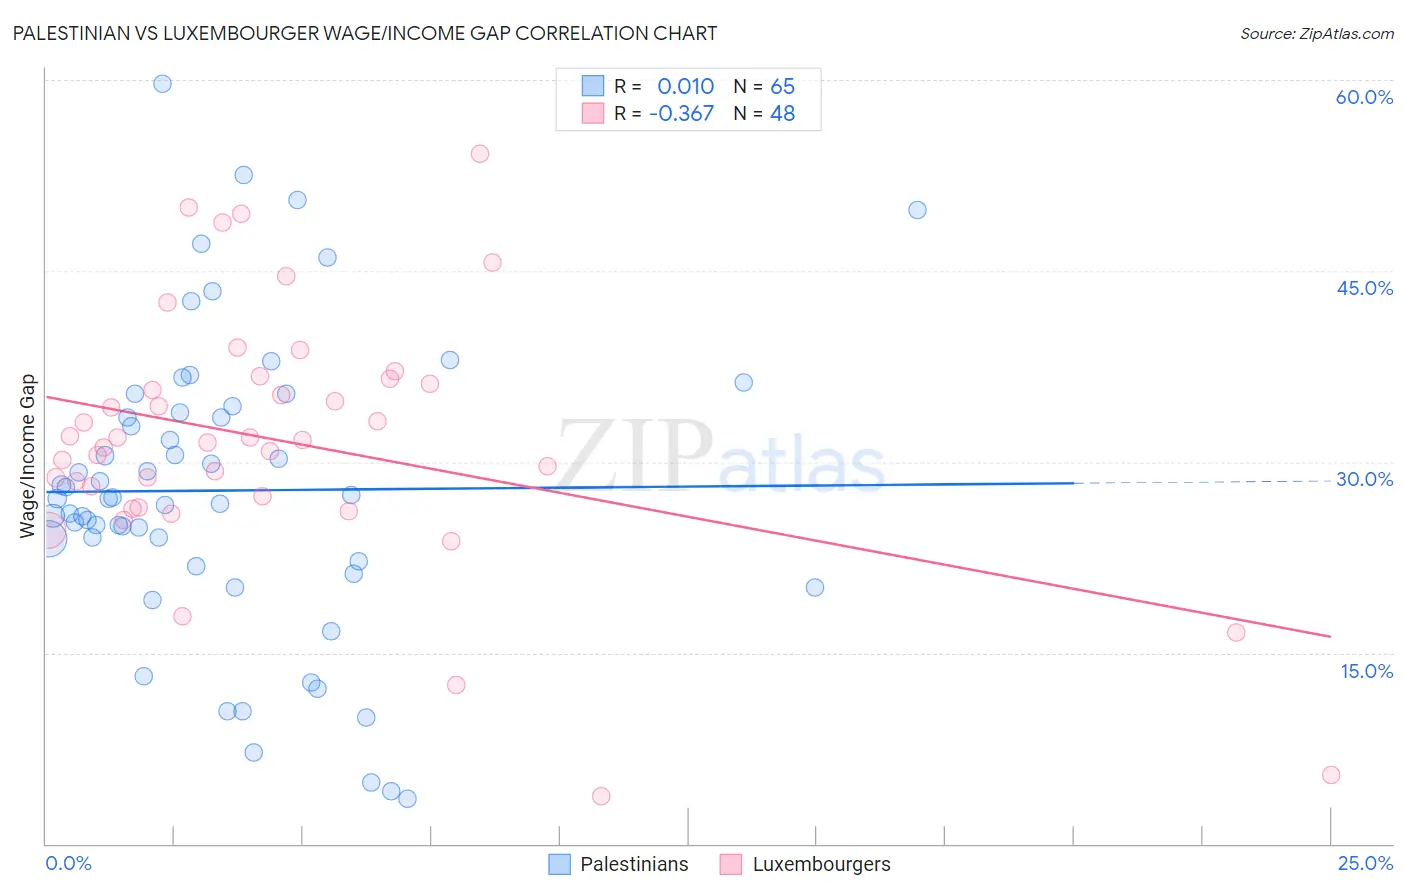
Palestinian vs Luxembourger Wage/Income Gap Correlation Chart
The statistical analysis conducted on geographies consisting of 216,443,706 people shows no correlation between the proportion of Palestinians and wage/income gap percentage in the United States with a correlation coefficient (R) of 0.010 and weighted average of 26.1%. Similarly, the statistical analysis conducted on geographies consisting of 144,643,301 people shows a mild negative correlation between the proportion of Luxembourgers and wage/income gap percentage in the United States with a correlation coefficient (R) of -0.367 and weighted average of 27.4%, a difference of 5.0%.
Wage/Income Gap Correlation Summary
| Measurement | Palestinian | Luxembourger |
| Minimum | 3.6% | 3.7% |
| Maximum | 59.7% | 54.2% |
| Range | 56.1% | 50.5% |
| Mean | 27.8% | 31.6% |
| Median | 27.1% | 31.6% |
| Interquartile 25% (IQ1) | 22.0% | 26.9% |
| Interquartile 75% (IQ3) | 34.1% | 36.3% |
| Interquartile Range (IQR) | 12.1% | 9.5% |
| Standard Deviation (Sample) | 11.7% | 10.1% |
| Standard Deviation (Population) | 11.6% | 10.0% |
Similar Demographics by Wage/Income Gap
Demographics Similar to Palestinians by Wage/Income Gap
In terms of wage/income gap, the demographic groups most similar to Palestinians are Immigrants from Egypt (26.1%, a difference of 0.010%), Immigrants from Indonesia (26.1%, a difference of 0.19%), Immigrants from Moldova (26.2%, a difference of 0.26%), Pakistani (26.1%, a difference of 0.28%), and Mexican (26.0%, a difference of 0.33%).
| Demographics | Rating | Rank | Wage/Income Gap |
| Guamanians/Chamorros | 38.0 /100 | #180 | Fair 26.0% |
| Immigrants | Bolivia | 36.4 /100 | #181 | Fair 26.0% |
| Immigrants | Serbia | 35.4 /100 | #182 | Fair 26.0% |
| Immigrants | Kazakhstan | 35.2 /100 | #183 | Fair 26.0% |
| Mexicans | 34.4 /100 | #184 | Fair 26.0% |
| Pakistanis | 33.7 /100 | #185 | Fair 26.1% |
| Immigrants | Indonesia | 32.5 /100 | #186 | Fair 26.1% |
| Palestinians | 29.9 /100 | #187 | Fair 26.1% |
| Immigrants | Egypt | 29.9 /100 | #188 | Fair 26.1% |
| Immigrants | Moldova | 26.6 /100 | #189 | Fair 26.2% |
| Immigrants | Croatia | 24.8 /100 | #190 | Fair 26.2% |
| Immigrants | Venezuela | 24.7 /100 | #191 | Fair 26.2% |
| Immigrants | Bulgaria | 22.5 /100 | #192 | Fair 26.3% |
| Immigrants | Jordan | 22.4 /100 | #193 | Fair 26.3% |
| Chileans | 22.3 /100 | #194 | Fair 26.3% |
Demographics Similar to Luxembourgers by Wage/Income Gap
In terms of wage/income gap, the demographic groups most similar to Luxembourgers are Slavic (27.4%, a difference of 0.040%), Cherokee (27.4%, a difference of 0.050%), Icelander (27.5%, a difference of 0.11%), Tongan (27.5%, a difference of 0.13%), and Immigrants from France (27.4%, a difference of 0.15%).
| Demographics | Rating | Rank | Wage/Income Gap |
| Immigrants | Czechoslovakia | 2.7 /100 | #250 | Tragic 27.3% |
| Immigrants | Norway | 2.5 /100 | #251 | Tragic 27.3% |
| Ukrainians | 2.4 /100 | #252 | Tragic 27.3% |
| Portuguese | 2.2 /100 | #253 | Tragic 27.4% |
| Israelis | 2.1 /100 | #254 | Tragic 27.4% |
| Immigrants | France | 2.1 /100 | #255 | Tragic 27.4% |
| Cherokee | 1.9 /100 | #256 | Tragic 27.4% |
| Luxembourgers | 1.9 /100 | #257 | Tragic 27.4% |
| Slavs | 1.8 /100 | #258 | Tragic 27.4% |
| Icelanders | 1.8 /100 | #259 | Tragic 27.5% |
| Tongans | 1.7 /100 | #260 | Tragic 27.5% |
| Immigrants | Germany | 1.5 /100 | #261 | Tragic 27.5% |
| Immigrants | Lebanon | 1.5 /100 | #262 | Tragic 27.5% |
| Syrians | 1.4 /100 | #263 | Tragic 27.6% |
| Immigrants | Switzerland | 1.0 /100 | #264 | Tragic 27.7% |