Palestinian vs Guyanese In Labor Force | Age 30-34
COMPARE
Palestinian
Guyanese
In Labor Force | Age 30-34
In Labor Force | Age 30-34 Comparison
Palestinians
Guyanese
84.9%
IN LABOR FORCE | AGE 30-34
77.7/ 100
METRIC RATING
145th/ 347
METRIC RANK
83.8%
IN LABOR FORCE | AGE 30-34
0.3/ 100
METRIC RATING
261st/ 347
METRIC RANK
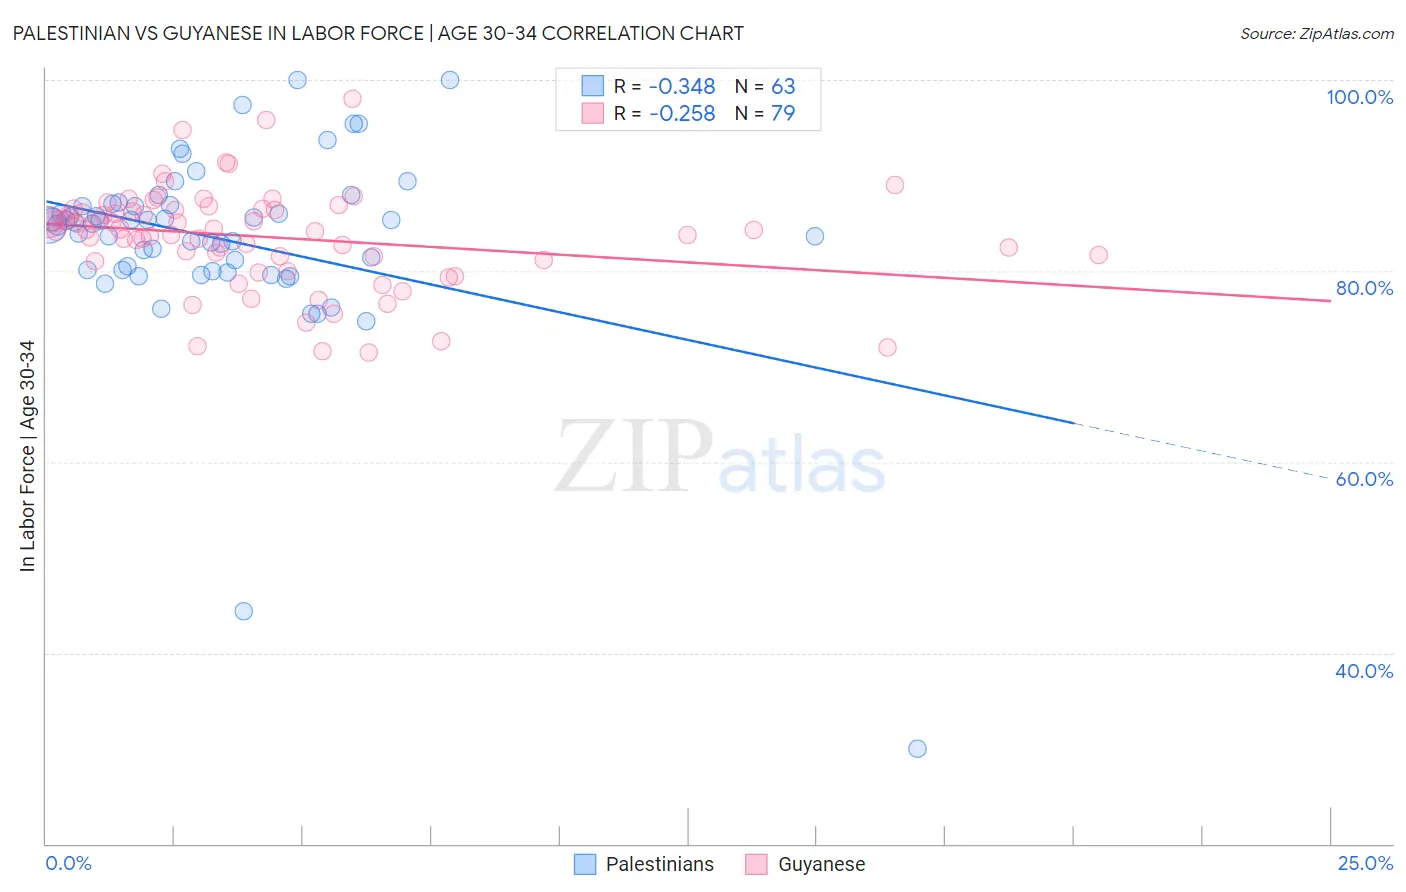
Palestinian vs Guyanese In Labor Force | Age 30-34 Correlation Chart
The statistical analysis conducted on geographies consisting of 216,407,612 people shows a mild negative correlation between the proportion of Palestinians and labor force participation rate among population between the ages 30 and 34 in the United States with a correlation coefficient (R) of -0.348 and weighted average of 84.9%. Similarly, the statistical analysis conducted on geographies consisting of 176,819,802 people shows a weak negative correlation between the proportion of Guyanese and labor force participation rate among population between the ages 30 and 34 in the United States with a correlation coefficient (R) of -0.258 and weighted average of 83.8%, a difference of 1.3%.
In Labor Force | Age 30-34 Correlation Summary
| Measurement | Palestinian | Guyanese |
| Minimum | 30.0% | 71.5% |
| Maximum | 100.0% | 98.1% |
| Range | 70.0% | 26.6% |
| Mean | 83.4% | 83.5% |
| Median | 84.9% | 84.3% |
| Interquartile 25% (IQ1) | 80.1% | 81.1% |
| Interquartile 75% (IQ3) | 86.9% | 86.4% |
| Interquartile Range (IQR) | 6.8% | 5.3% |
| Standard Deviation (Sample) | 10.2% | 5.2% |
| Standard Deviation (Population) | 10.1% | 5.2% |
Similar Demographics by In Labor Force | Age 30-34
Demographics Similar to Palestinians by In Labor Force | Age 30-34
In terms of in labor force | age 30-34, the demographic groups most similar to Palestinians are Uruguayan (84.9%, a difference of 0.010%), Immigrants from Saudi Arabia (84.9%, a difference of 0.010%), Immigrants from Colombia (84.9%, a difference of 0.010%), Immigrants from Pakistan (84.9%, a difference of 0.010%), and Immigrants from Ukraine (84.8%, a difference of 0.020%).
| Demographics | Rating | Rank | In Labor Force | Age 30-34 |
| Sri Lankans | 87.8 /100 | #138 | Excellent 85.0% |
| Bhutanese | 87.5 /100 | #139 | Excellent 85.0% |
| Immigrants | Vietnam | 86.5 /100 | #140 | Excellent 85.0% |
| Chileans | 85.3 /100 | #141 | Excellent 84.9% |
| Immigrants | Indonesia | 84.3 /100 | #142 | Excellent 84.9% |
| Colombians | 82.2 /100 | #143 | Excellent 84.9% |
| Uruguayans | 78.5 /100 | #144 | Good 84.9% |
| Palestinians | 77.7 /100 | #145 | Good 84.9% |
| Immigrants | Saudi Arabia | 76.6 /100 | #146 | Good 84.9% |
| Immigrants | Colombia | 76.3 /100 | #147 | Good 84.9% |
| Immigrants | Pakistan | 76.2 /100 | #148 | Good 84.9% |
| Immigrants | Ukraine | 75.1 /100 | #149 | Good 84.8% |
| Germans | 75.1 /100 | #150 | Good 84.8% |
| Immigrants | Senegal | 74.0 /100 | #151 | Good 84.8% |
| Romanians | 73.5 /100 | #152 | Good 84.8% |
Demographics Similar to Guyanese by In Labor Force | Age 30-34
In terms of in labor force | age 30-34, the demographic groups most similar to Guyanese are Immigrants from Dominican Republic (83.8%, a difference of 0.010%), Scotch-Irish (83.8%, a difference of 0.020%), Dominican (83.8%, a difference of 0.020%), Immigrants from Guyana (83.8%, a difference of 0.020%), and Honduran (83.8%, a difference of 0.030%).
| Demographics | Rating | Rank | In Labor Force | Age 30-34 |
| Immigrants | St. Vincent and the Grenadines | 0.5 /100 | #254 | Tragic 83.9% |
| Whites/Caucasians | 0.5 /100 | #255 | Tragic 83.9% |
| Immigrants | Lebanon | 0.4 /100 | #256 | Tragic 83.9% |
| Iraqis | 0.3 /100 | #257 | Tragic 83.8% |
| Hondurans | 0.3 /100 | #258 | Tragic 83.8% |
| Scotch-Irish | 0.3 /100 | #259 | Tragic 83.8% |
| Immigrants | Dominican Republic | 0.3 /100 | #260 | Tragic 83.8% |
| Guyanese | 0.3 /100 | #261 | Tragic 83.8% |
| Dominicans | 0.2 /100 | #262 | Tragic 83.8% |
| Immigrants | Guyana | 0.2 /100 | #263 | Tragic 83.8% |
| Guatemalans | 0.2 /100 | #264 | Tragic 83.7% |
| Immigrants | Honduras | 0.1 /100 | #265 | Tragic 83.7% |
| Immigrants | Guatemala | 0.1 /100 | #266 | Tragic 83.7% |
| Spaniards | 0.1 /100 | #267 | Tragic 83.6% |
| Immigrants | Bangladesh | 0.1 /100 | #268 | Tragic 83.6% |