Pakistani vs Immigrants from Netherlands Nursery School
COMPARE
Pakistani
Immigrants from Netherlands
Nursery School
Nursery School Comparison
Pakistanis
Immigrants from Netherlands
97.9%
NURSERY SCHOOL
34.6/ 100
METRIC RATING
189th/ 347
METRIC RANK
98.4%
NURSERY SCHOOL
99.4/ 100
METRIC RATING
74th/ 347
METRIC RANK
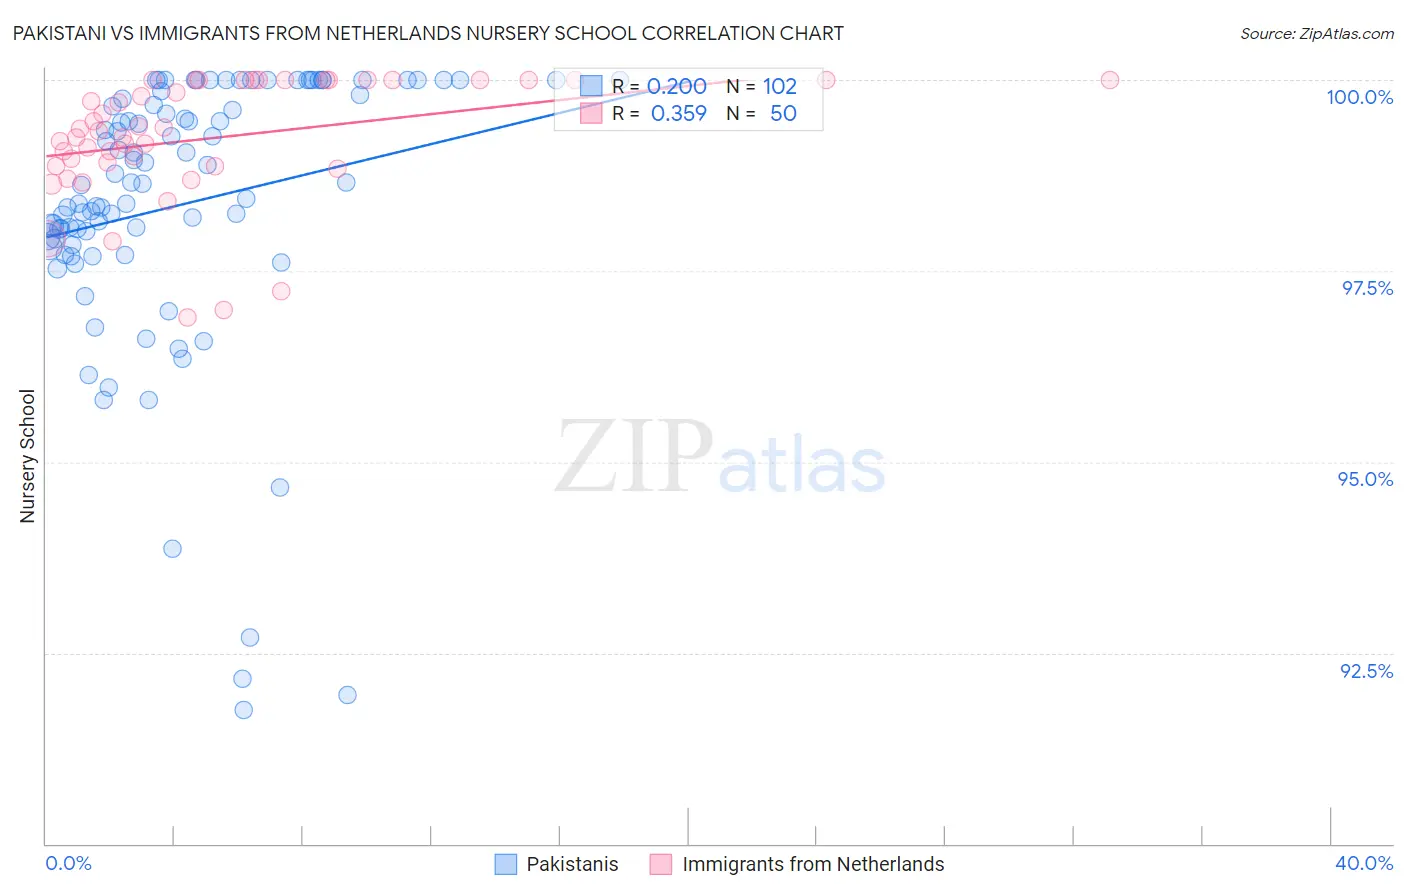
Pakistani vs Immigrants from Netherlands Nursery School Correlation Chart
The statistical analysis conducted on geographies consisting of 335,355,426 people shows a poor positive correlation between the proportion of Pakistanis and percentage of population with at least nursery school education in the United States with a correlation coefficient (R) of 0.200 and weighted average of 97.9%. Similarly, the statistical analysis conducted on geographies consisting of 237,869,934 people shows a mild positive correlation between the proportion of Immigrants from Netherlands and percentage of population with at least nursery school education in the United States with a correlation coefficient (R) of 0.359 and weighted average of 98.4%, a difference of 0.43%.
Nursery School Correlation Summary
| Measurement | Pakistani | Immigrants from Netherlands |
| Minimum | 91.8% | 96.9% |
| Maximum | 100.0% | 100.0% |
| Range | 8.2% | 3.1% |
| Mean | 98.4% | 99.2% |
| Median | 98.6% | 99.3% |
| Interquartile 25% (IQ1) | 97.8% | 98.9% |
| Interquartile 75% (IQ3) | 99.8% | 100.0% |
| Interquartile Range (IQR) | 2.0% | 1.1% |
| Standard Deviation (Sample) | 1.8% | 0.80% |
| Standard Deviation (Population) | 1.8% | 0.79% |
Similar Demographics by Nursery School
Demographics Similar to Pakistanis by Nursery School
In terms of nursery school, the demographic groups most similar to Pakistanis are Arab (97.9%, a difference of 0.0%), Panamanian (97.9%, a difference of 0.0%), Immigrants from Kazakhstan (97.9%, a difference of 0.010%), Immigrants from Taiwan (97.9%, a difference of 0.010%), and Paiute (98.0%, a difference of 0.020%).
| Demographics | Rating | Rank | Nursery School |
| Paiute | 42.0 /100 | #182 | Average 98.0% |
| Portuguese | 41.8 /100 | #183 | Average 98.0% |
| Immigrants | Poland | 41.3 /100 | #184 | Average 98.0% |
| Immigrants | Belarus | 41.0 /100 | #185 | Average 98.0% |
| Immigrants | Argentina | 40.8 /100 | #186 | Average 98.0% |
| Immigrants | Kazakhstan | 37.1 /100 | #187 | Fair 97.9% |
| Arabs | 34.7 /100 | #188 | Fair 97.9% |
| Pakistanis | 34.6 /100 | #189 | Fair 97.9% |
| Panamanians | 34.3 /100 | #190 | Fair 97.9% |
| Immigrants | Taiwan | 30.6 /100 | #191 | Fair 97.9% |
| Blacks/African Americans | 29.4 /100 | #192 | Fair 97.9% |
| Paraguayans | 27.4 /100 | #193 | Fair 97.9% |
| Mongolians | 27.3 /100 | #194 | Fair 97.9% |
| Hawaiians | 27.2 /100 | #195 | Fair 97.9% |
| Guamanians/Chamorros | 25.7 /100 | #196 | Fair 97.9% |
Demographics Similar to Immigrants from Netherlands by Nursery School
In terms of nursery school, the demographic groups most similar to Immigrants from Netherlands are Cajun (98.4%, a difference of 0.0%), Cherokee (98.3%, a difference of 0.010%), Immigrants from England (98.3%, a difference of 0.010%), Immigrants from Lithuania (98.3%, a difference of 0.010%), and Delaware (98.3%, a difference of 0.010%).
| Demographics | Rating | Rank | Nursery School |
| Immigrants | Northern Europe | 99.6 /100 | #67 | Exceptional 98.4% |
| Russians | 99.6 /100 | #68 | Exceptional 98.4% |
| Immigrants | Austria | 99.6 /100 | #69 | Exceptional 98.4% |
| Cheyenne | 99.6 /100 | #70 | Exceptional 98.4% |
| Serbians | 99.6 /100 | #71 | Exceptional 98.4% |
| Chickasaw | 99.6 /100 | #72 | Exceptional 98.4% |
| Cajuns | 99.4 /100 | #73 | Exceptional 98.4% |
| Immigrants | Netherlands | 99.4 /100 | #74 | Exceptional 98.4% |
| Cherokee | 99.3 /100 | #75 | Exceptional 98.3% |
| Immigrants | England | 99.3 /100 | #76 | Exceptional 98.3% |
| Immigrants | Lithuania | 99.3 /100 | #77 | Exceptional 98.3% |
| Delaware | 99.3 /100 | #78 | Exceptional 98.3% |
| Immigrants | Belgium | 99.3 /100 | #79 | Exceptional 98.3% |
| Shoshone | 99.3 /100 | #80 | Exceptional 98.3% |
| Icelanders | 99.2 /100 | #81 | Exceptional 98.3% |