Pakistani vs Korean Median Male Earnings
COMPARE
Pakistani
Korean
Median Male Earnings
Median Male Earnings Comparison
Pakistanis
Koreans
$56,719
MEDIAN MALE EARNINGS
89.9/ 100
METRIC RATING
129th/ 347
METRIC RANK
$56,672
MEDIAN MALE EARNINGS
89.4/ 100
METRIC RATING
130th/ 347
METRIC RANK
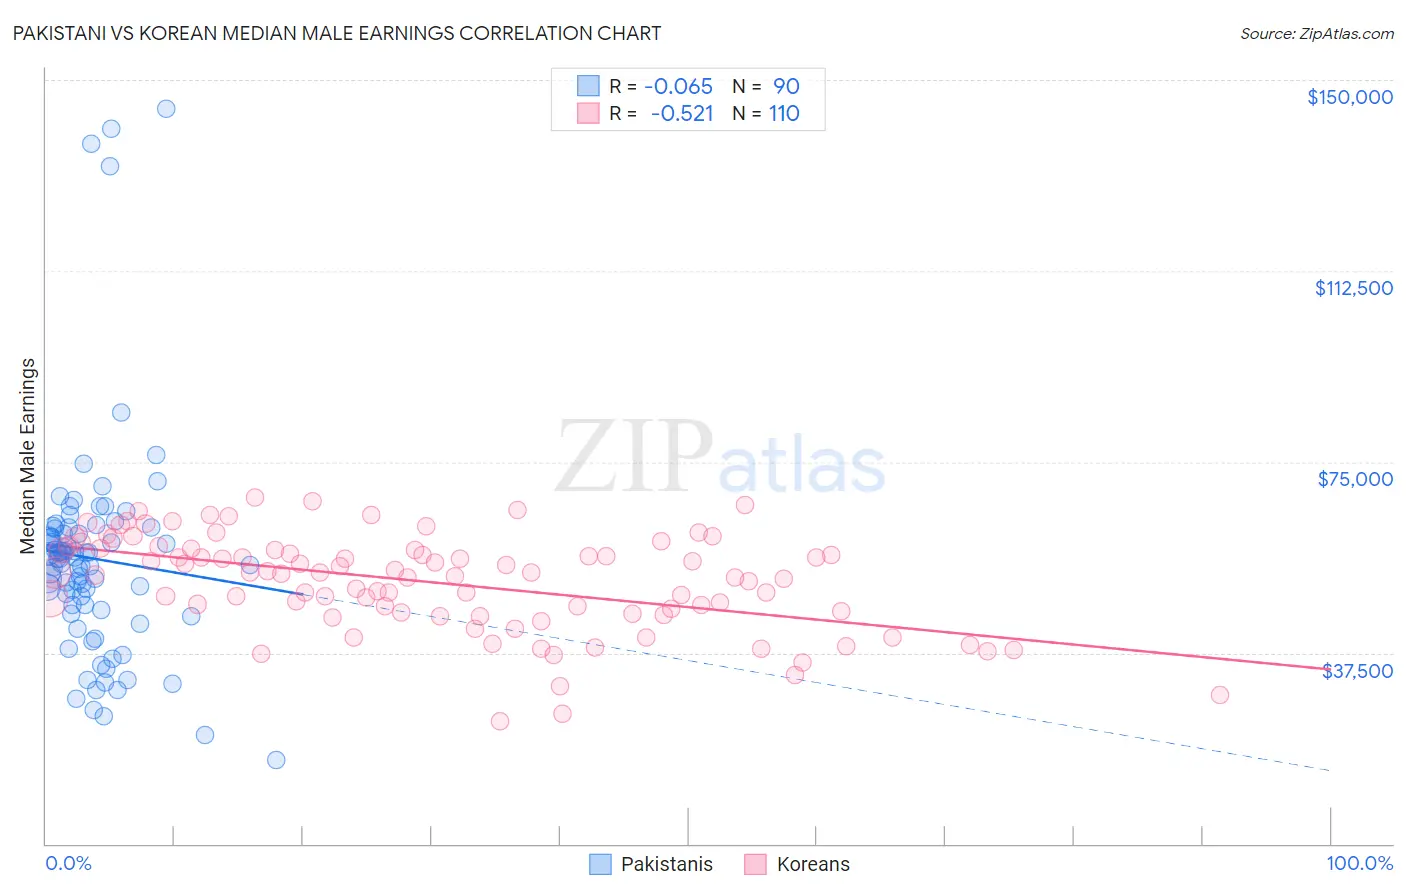
Pakistani vs Korean Median Male Earnings Correlation Chart
The statistical analysis conducted on geographies consisting of 335,324,155 people shows a slight negative correlation between the proportion of Pakistanis and median male earnings in the United States with a correlation coefficient (R) of -0.065 and weighted average of $56,719. Similarly, the statistical analysis conducted on geographies consisting of 510,664,628 people shows a substantial negative correlation between the proportion of Koreans and median male earnings in the United States with a correlation coefficient (R) of -0.521 and weighted average of $56,672, a difference of 0.080%.
Median Male Earnings Correlation Summary
| Measurement | Pakistani | Korean |
| Minimum | $16,406 | $24,028 |
| Maximum | $144,236 | $67,994 |
| Range | $127,830 | $43,966 |
| Mean | $56,003 | $51,299 |
| Median | $55,878 | $53,093 |
| Interquartile 25% (IQ1) | $45,960 | $45,357 |
| Interquartile 75% (IQ3) | $61,933 | $57,742 |
| Interquartile Range (IQR) | $15,973 | $12,385 |
| Standard Deviation (Sample) | $22,100 | $9,399 |
| Standard Deviation (Population) | $21,977 | $9,356 |
Demographics Similar to Pakistanis and Koreans by Median Male Earnings
In terms of median male earnings, the demographic groups most similar to Pakistanis are Portuguese ($56,663, a difference of 0.10%), Immigrants from Syria ($56,830, a difference of 0.20%), Brazilian ($56,837, a difference of 0.21%), Chinese ($56,872, a difference of 0.27%), and Czech ($56,546, a difference of 0.31%). Similarly, the demographic groups most similar to Koreans are Portuguese ($56,663, a difference of 0.020%), Czech ($56,546, a difference of 0.22%), Immigrants from Germany ($56,542, a difference of 0.23%), Immigrants from Syria ($56,830, a difference of 0.28%), and Brazilian ($56,837, a difference of 0.29%).
| Demographics | Rating | Rank | Median Male Earnings |
| Arabs | 94.0 /100 | #119 | Exceptional $57,298 |
| Canadians | 93.9 /100 | #120 | Exceptional $57,286 |
| Immigrants | Albania | 93.3 /100 | #121 | Exceptional $57,179 |
| Immigrants | Jordan | 93.1 /100 | #122 | Exceptional $57,145 |
| Slovenes | 93.1 /100 | #123 | Exceptional $57,145 |
| Chileans | 91.9 /100 | #124 | Exceptional $56,973 |
| Immigrants | Morocco | 91.8 /100 | #125 | Exceptional $56,958 |
| Chinese | 91.1 /100 | #126 | Exceptional $56,872 |
| Brazilians | 90.9 /100 | #127 | Exceptional $56,837 |
| Immigrants | Syria | 90.8 /100 | #128 | Exceptional $56,830 |
| Pakistanis | 89.9 /100 | #129 | Excellent $56,719 |
| Koreans | 89.4 /100 | #130 | Excellent $56,672 |
| Portuguese | 89.4 /100 | #131 | Excellent $56,663 |
| Czechs | 88.2 /100 | #132 | Excellent $56,546 |
| Immigrants | Germany | 88.2 /100 | #133 | Excellent $56,542 |
| Moroccans | 87.7 /100 | #134 | Excellent $56,499 |
| Irish | 87.4 /100 | #135 | Excellent $56,464 |
| Immigrants | Saudi Arabia | 87.2 /100 | #136 | Excellent $56,452 |
| Slavs | 86.5 /100 | #137 | Excellent $56,390 |
| Slovaks | 85.5 /100 | #138 | Excellent $56,306 |
| Zimbabweans | 85.5 /100 | #139 | Excellent $56,302 |