Pakistani vs Immigrants from Bulgaria Median Male Earnings
COMPARE
Pakistani
Immigrants from Bulgaria
Median Male Earnings
Median Male Earnings Comparison
Pakistanis
Immigrants from Bulgaria
$56,719
MEDIAN MALE EARNINGS
89.9/ 100
METRIC RATING
129th/ 347
METRIC RANK
$60,358
MEDIAN MALE EARNINGS
99.7/ 100
METRIC RATING
70th/ 347
METRIC RANK
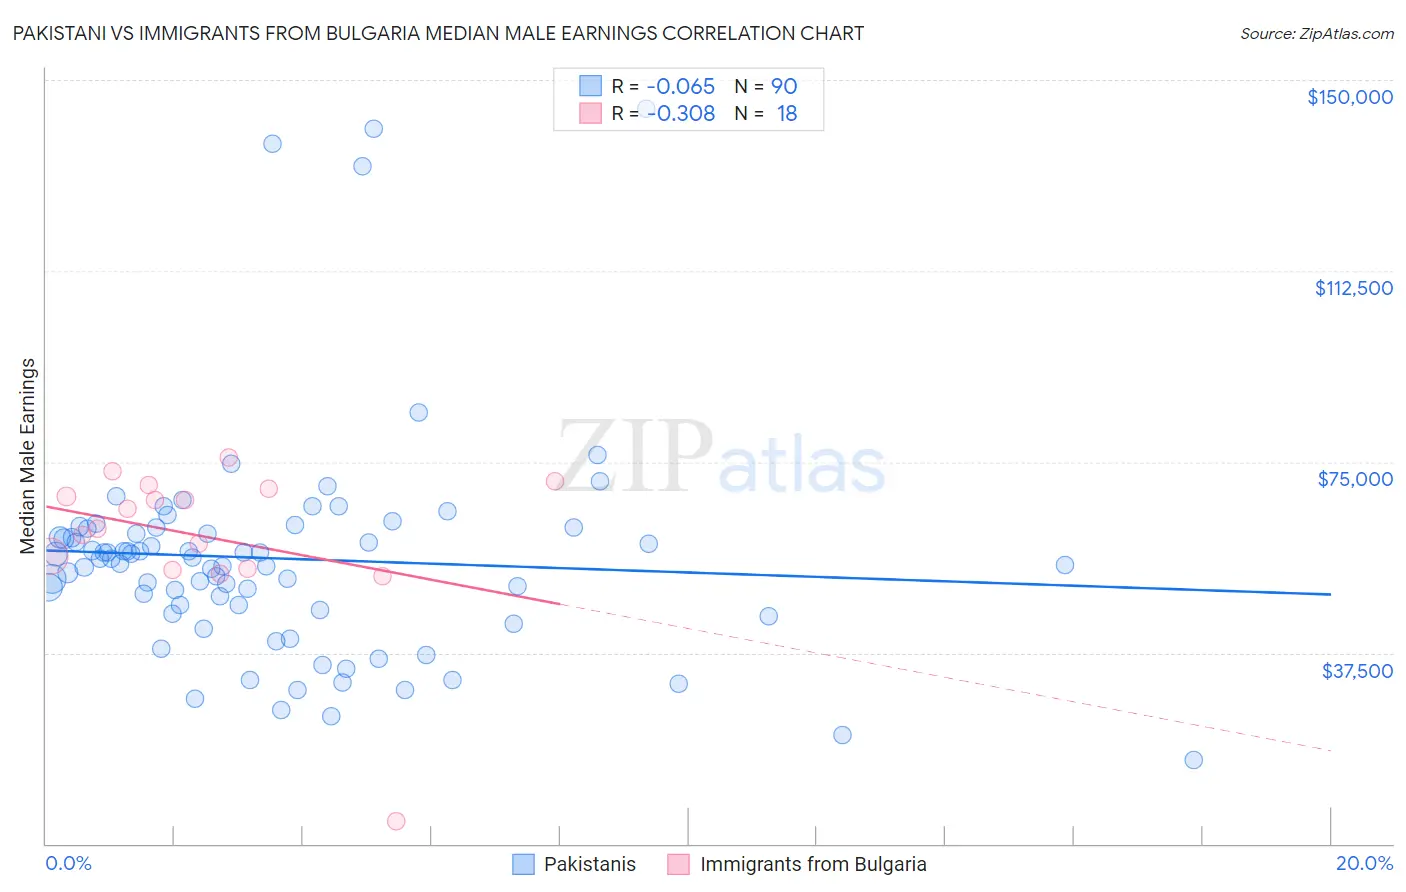
Pakistani vs Immigrants from Bulgaria Median Male Earnings Correlation Chart
The statistical analysis conducted on geographies consisting of 335,324,155 people shows a slight negative correlation between the proportion of Pakistanis and median male earnings in the United States with a correlation coefficient (R) of -0.065 and weighted average of $56,719. Similarly, the statistical analysis conducted on geographies consisting of 172,534,572 people shows a mild negative correlation between the proportion of Immigrants from Bulgaria and median male earnings in the United States with a correlation coefficient (R) of -0.308 and weighted average of $60,358, a difference of 6.4%.
Median Male Earnings Correlation Summary
| Measurement | Pakistani | Immigrants from Bulgaria |
| Minimum | $16,406 | $4,447 |
| Maximum | $144,236 | $75,897 |
| Range | $127,830 | $71,450 |
| Mean | $56,003 | $60,294 |
| Median | $55,878 | $63,912 |
| Interquartile 25% (IQ1) | $45,960 | $54,049 |
| Interquartile 75% (IQ3) | $61,933 | $69,736 |
| Interquartile Range (IQR) | $15,973 | $15,687 |
| Standard Deviation (Sample) | $22,100 | $15,823 |
| Standard Deviation (Population) | $21,977 | $15,377 |
Similar Demographics by Median Male Earnings
Demographics Similar to Pakistanis by Median Male Earnings
In terms of median male earnings, the demographic groups most similar to Pakistanis are Korean ($56,672, a difference of 0.080%), Portuguese ($56,663, a difference of 0.10%), Immigrants from Syria ($56,830, a difference of 0.20%), Brazilian ($56,837, a difference of 0.21%), and Chinese ($56,872, a difference of 0.27%).
| Demographics | Rating | Rank | Median Male Earnings |
| Immigrants | Jordan | 93.1 /100 | #122 | Exceptional $57,145 |
| Slovenes | 93.1 /100 | #123 | Exceptional $57,145 |
| Chileans | 91.9 /100 | #124 | Exceptional $56,973 |
| Immigrants | Morocco | 91.8 /100 | #125 | Exceptional $56,958 |
| Chinese | 91.1 /100 | #126 | Exceptional $56,872 |
| Brazilians | 90.9 /100 | #127 | Exceptional $56,837 |
| Immigrants | Syria | 90.8 /100 | #128 | Exceptional $56,830 |
| Pakistanis | 89.9 /100 | #129 | Excellent $56,719 |
| Koreans | 89.4 /100 | #130 | Excellent $56,672 |
| Portuguese | 89.4 /100 | #131 | Excellent $56,663 |
| Czechs | 88.2 /100 | #132 | Excellent $56,546 |
| Immigrants | Germany | 88.2 /100 | #133 | Excellent $56,542 |
| Moroccans | 87.7 /100 | #134 | Excellent $56,499 |
| Irish | 87.4 /100 | #135 | Excellent $56,464 |
| Immigrants | Saudi Arabia | 87.2 /100 | #136 | Excellent $56,452 |
Demographics Similar to Immigrants from Bulgaria by Median Male Earnings
In terms of median male earnings, the demographic groups most similar to Immigrants from Bulgaria are Mongolian ($60,350, a difference of 0.010%), Immigrants from Western Europe ($60,334, a difference of 0.040%), Immigrants from Canada ($60,388, a difference of 0.050%), Immigrants from North America ($60,265, a difference of 0.16%), and Immigrants from Serbia ($60,600, a difference of 0.40%).
| Demographics | Rating | Rank | Median Male Earnings |
| Immigrants | Pakistan | 99.8 /100 | #63 | Exceptional $60,987 |
| Immigrants | Eastern Europe | 99.8 /100 | #64 | Exceptional $60,958 |
| Immigrants | Indonesia | 99.8 /100 | #65 | Exceptional $60,935 |
| Immigrants | Croatia | 99.8 /100 | #66 | Exceptional $60,914 |
| Immigrants | Spain | 99.8 /100 | #67 | Exceptional $60,750 |
| Immigrants | Serbia | 99.7 /100 | #68 | Exceptional $60,600 |
| Immigrants | Canada | 99.7 /100 | #69 | Exceptional $60,388 |
| Immigrants | Bulgaria | 99.7 /100 | #70 | Exceptional $60,358 |
| Mongolians | 99.7 /100 | #71 | Exceptional $60,350 |
| Immigrants | Western Europe | 99.7 /100 | #72 | Exceptional $60,334 |
| Immigrants | North America | 99.7 /100 | #73 | Exceptional $60,265 |
| Argentineans | 99.6 /100 | #74 | Exceptional $60,117 |
| Immigrants | Bolivia | 99.6 /100 | #75 | Exceptional $60,088 |
| Romanians | 99.6 /100 | #76 | Exceptional $60,063 |
| Paraguayans | 99.5 /100 | #77 | Exceptional $59,975 |