Pakistani vs British Median Male Earnings
COMPARE
Pakistani
British
Median Male Earnings
Median Male Earnings Comparison
Pakistanis
British
$56,719
MEDIAN MALE EARNINGS
89.9/ 100
METRIC RATING
129th/ 347
METRIC RANK
$57,890
MEDIAN MALE EARNINGS
96.5/ 100
METRIC RATING
109th/ 347
METRIC RANK
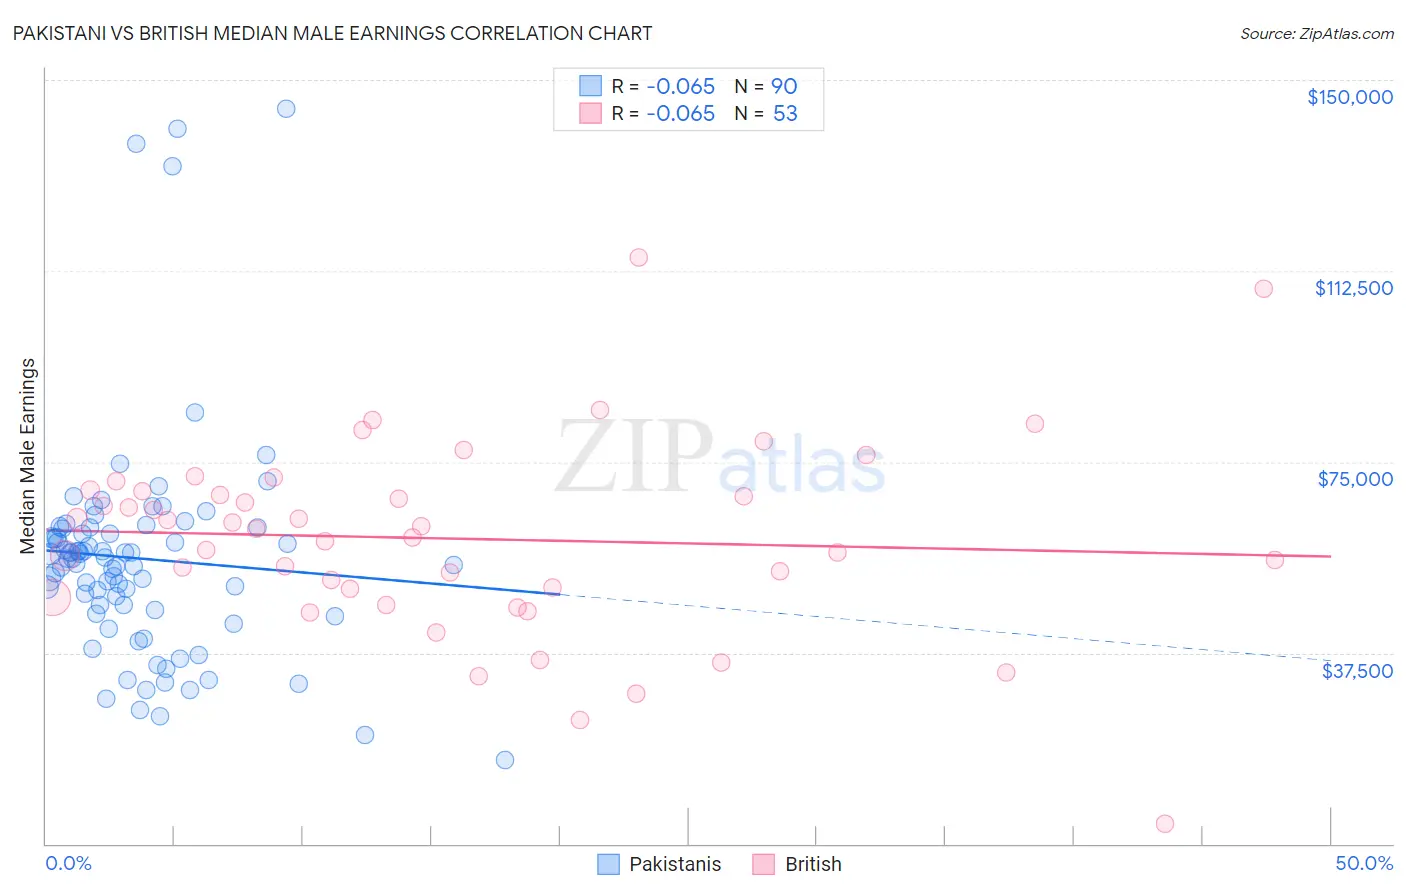
Pakistani vs British Median Male Earnings Correlation Chart
The statistical analysis conducted on geographies consisting of 335,324,155 people shows a slight negative correlation between the proportion of Pakistanis and median male earnings in the United States with a correlation coefficient (R) of -0.065 and weighted average of $56,719. Similarly, the statistical analysis conducted on geographies consisting of 530,851,960 people shows a slight negative correlation between the proportion of British and median male earnings in the United States with a correlation coefficient (R) of -0.065 and weighted average of $57,890, a difference of 2.1%.
Median Male Earnings Correlation Summary
| Measurement | Pakistani | British |
| Minimum | $16,406 | $3,957 |
| Maximum | $144,236 | $115,192 |
| Range | $127,830 | $111,235 |
| Mean | $56,003 | $59,934 |
| Median | $55,878 | $61,983 |
| Interquartile 25% (IQ1) | $45,960 | $49,275 |
| Interquartile 75% (IQ3) | $61,933 | $69,382 |
| Interquartile Range (IQR) | $15,973 | $20,107 |
| Standard Deviation (Sample) | $22,100 | $19,214 |
| Standard Deviation (Population) | $21,977 | $19,032 |
Demographics Similar to Pakistanis and British by Median Male Earnings
In terms of median male earnings, the demographic groups most similar to Pakistanis are Immigrants from Syria ($56,830, a difference of 0.20%), Brazilian ($56,837, a difference of 0.21%), Chinese ($56,872, a difference of 0.27%), Immigrants from Morocco ($56,958, a difference of 0.42%), and Chilean ($56,973, a difference of 0.45%). Similarly, the demographic groups most similar to British are Palestinian ($57,778, a difference of 0.19%), European ($57,637, a difference of 0.44%), Immigrants from Afghanistan ($57,582, a difference of 0.53%), Carpatho Rusyn ($57,572, a difference of 0.55%), and Immigrants from Kuwait ($57,562, a difference of 0.57%).
| Demographics | Rating | Rank | Median Male Earnings |
| British | 96.5 /100 | #109 | Exceptional $57,890 |
| Palestinians | 96.2 /100 | #110 | Exceptional $57,778 |
| Europeans | 95.6 /100 | #111 | Exceptional $57,637 |
| Immigrants | Afghanistan | 95.4 /100 | #112 | Exceptional $57,582 |
| Carpatho Rusyns | 95.3 /100 | #113 | Exceptional $57,572 |
| Immigrants | Kuwait | 95.3 /100 | #114 | Exceptional $57,562 |
| Swedes | 94.8 /100 | #115 | Exceptional $57,445 |
| Lebanese | 94.6 /100 | #116 | Exceptional $57,409 |
| Immigrants | Zimbabwe | 94.3 /100 | #117 | Exceptional $57,352 |
| Hungarians | 94.0 /100 | #118 | Exceptional $57,309 |
| Arabs | 94.0 /100 | #119 | Exceptional $57,298 |
| Canadians | 93.9 /100 | #120 | Exceptional $57,286 |
| Immigrants | Albania | 93.3 /100 | #121 | Exceptional $57,179 |
| Immigrants | Jordan | 93.1 /100 | #122 | Exceptional $57,145 |
| Slovenes | 93.1 /100 | #123 | Exceptional $57,145 |
| Chileans | 91.9 /100 | #124 | Exceptional $56,973 |
| Immigrants | Morocco | 91.8 /100 | #125 | Exceptional $56,958 |
| Chinese | 91.1 /100 | #126 | Exceptional $56,872 |
| Brazilians | 90.9 /100 | #127 | Exceptional $56,837 |
| Immigrants | Syria | 90.8 /100 | #128 | Exceptional $56,830 |
| Pakistanis | 89.9 /100 | #129 | Excellent $56,719 |