Pakistani vs Canadian Median Female Earnings
COMPARE
Pakistani
Canadian
Median Female Earnings
Median Female Earnings Comparison
Pakistanis
Canadians
$40,596
MEDIAN FEMALE EARNINGS
86.6/ 100
METRIC RATING
137th/ 347
METRIC RANK
$39,724
MEDIAN FEMALE EARNINGS
51.4/ 100
METRIC RATING
173rd/ 347
METRIC RANK
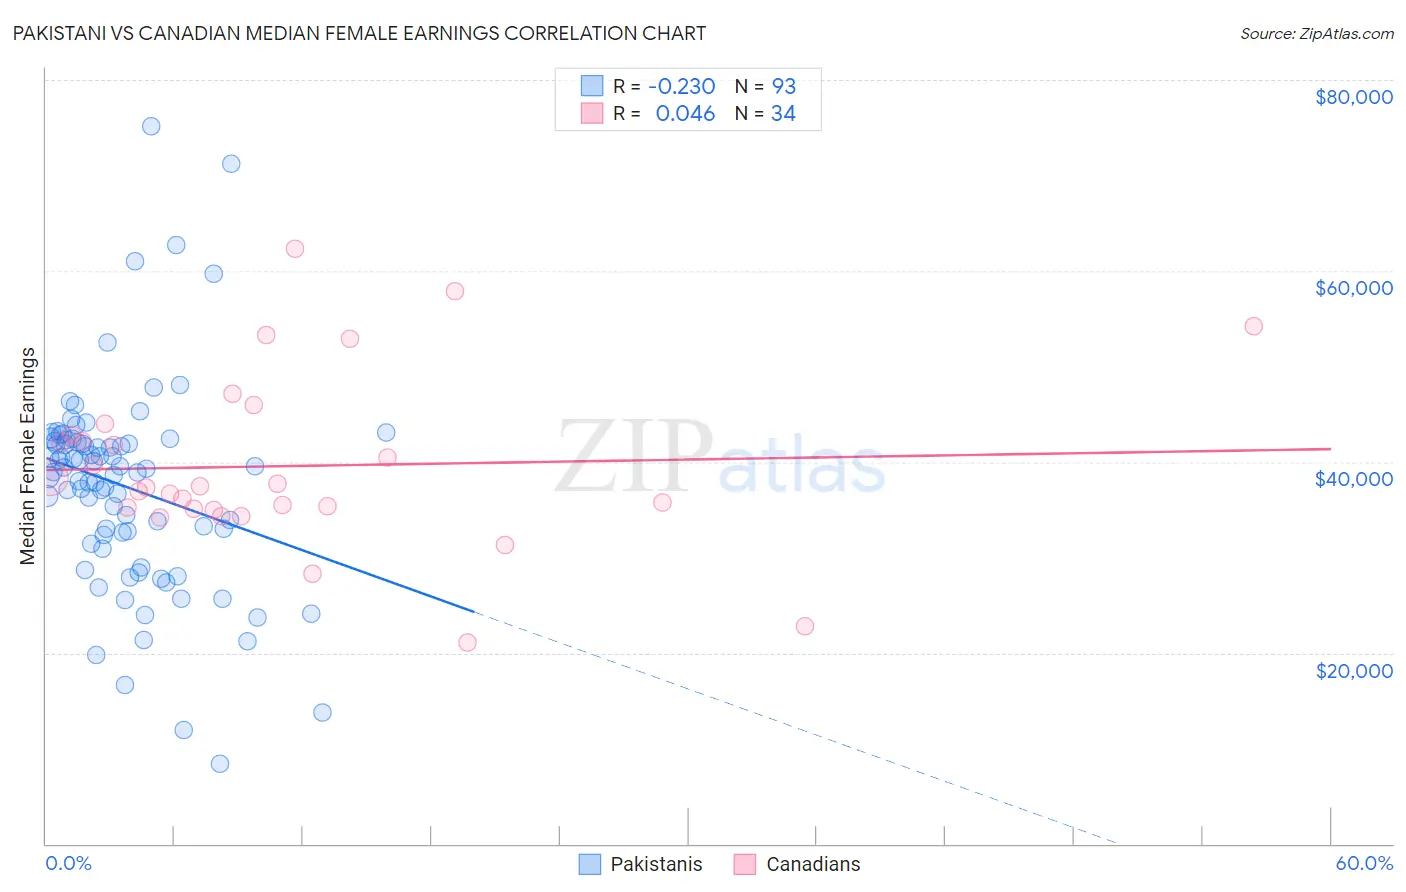
Pakistani vs Canadian Median Female Earnings Correlation Chart
The statistical analysis conducted on geographies consisting of 335,277,808 people shows a weak negative correlation between the proportion of Pakistanis and median female earnings in the United States with a correlation coefficient (R) of -0.230 and weighted average of $40,596. Similarly, the statistical analysis conducted on geographies consisting of 437,261,658 people shows no correlation between the proportion of Canadians and median female earnings in the United States with a correlation coefficient (R) of 0.046 and weighted average of $39,724, a difference of 2.2%.
Median Female Earnings Correlation Summary
| Measurement | Pakistani | Canadian |
| Minimum | $8,380 | $21,111 |
| Maximum | $75,132 | $62,276 |
| Range | $66,752 | $41,165 |
| Mean | $37,425 | $39,561 |
| Median | $38,904 | $37,391 |
| Interquartile 25% (IQ1) | $31,921 | $35,143 |
| Interquartile 75% (IQ3) | $42,191 | $42,841 |
| Interquartile Range (IQR) | $10,270 | $7,698 |
| Standard Deviation (Sample) | $10,860 | $8,927 |
| Standard Deviation (Population) | $10,802 | $8,795 |
Similar Demographics by Median Female Earnings
Demographics Similar to Pakistanis by Median Female Earnings
In terms of median female earnings, the demographic groups most similar to Pakistanis are Taiwanese ($40,576, a difference of 0.050%), Immigrants from South Eastern Asia ($40,558, a difference of 0.090%), Immigrants from Eastern Africa ($40,644, a difference of 0.12%), Serbian ($40,539, a difference of 0.14%), and Immigrants from Syria ($40,499, a difference of 0.24%).
| Demographics | Rating | Rank | Median Female Earnings |
| Immigrants | Guyana | 90.3 /100 | #130 | Exceptional $40,773 |
| Chileans | 90.0 /100 | #131 | Exceptional $40,757 |
| Immigrants | Uganda | 89.7 /100 | #132 | Excellent $40,739 |
| Syrians | 89.5 /100 | #133 | Excellent $40,727 |
| Arabs | 89.3 /100 | #134 | Excellent $40,718 |
| Immigrants | Nepal | 89.0 /100 | #135 | Excellent $40,704 |
| Immigrants | Eastern Africa | 87.7 /100 | #136 | Excellent $40,644 |
| Pakistanis | 86.6 /100 | #137 | Excellent $40,596 |
| Taiwanese | 86.1 /100 | #138 | Excellent $40,576 |
| Immigrants | South Eastern Asia | 85.7 /100 | #139 | Excellent $40,558 |
| Serbians | 85.2 /100 | #140 | Excellent $40,539 |
| Immigrants | Syria | 84.1 /100 | #141 | Excellent $40,499 |
| Sri Lankans | 84.0 /100 | #142 | Excellent $40,496 |
| Northern Europeans | 83.9 /100 | #143 | Excellent $40,491 |
| Immigrants | North Macedonia | 83.8 /100 | #144 | Excellent $40,488 |
Demographics Similar to Canadians by Median Female Earnings
In terms of median female earnings, the demographic groups most similar to Canadians are South American ($39,698, a difference of 0.070%), British ($39,772, a difference of 0.12%), Immigrants from Portugal ($39,788, a difference of 0.16%), Immigrants from South America ($39,643, a difference of 0.20%), and Nigerian ($39,641, a difference of 0.21%).
| Demographics | Rating | Rank | Median Female Earnings |
| Immigrants | Ghana | 60.0 /100 | #166 | Good $39,894 |
| Luxembourgers | 59.9 /100 | #167 | Average $39,891 |
| Immigrants | Peru | 58.9 /100 | #168 | Average $39,871 |
| Kenyans | 58.4 /100 | #169 | Average $39,860 |
| Slovenes | 56.2 /100 | #170 | Average $39,817 |
| Immigrants | Portugal | 54.7 /100 | #171 | Average $39,788 |
| British | 53.8 /100 | #172 | Average $39,772 |
| Canadians | 51.4 /100 | #173 | Average $39,724 |
| South Americans | 50.0 /100 | #174 | Average $39,698 |
| Immigrants | South America | 47.2 /100 | #175 | Average $39,643 |
| Nigerians | 47.0 /100 | #176 | Average $39,641 |
| Costa Ricans | 46.1 /100 | #177 | Average $39,622 |
| Slavs | 45.6 /100 | #178 | Average $39,613 |
| Immigrants | Germany | 45.1 /100 | #179 | Average $39,603 |
| Immigrants | Kenya | 41.6 /100 | #180 | Average $39,535 |