Lithuanian vs Canadian Median Female Earnings
COMPARE
Lithuanian
Canadian
Median Female Earnings
Median Female Earnings Comparison
Lithuanians
Canadians
$42,108
MEDIAN FEMALE EARNINGS
99.3/ 100
METRIC RATING
87th/ 347
METRIC RANK
$39,724
MEDIAN FEMALE EARNINGS
51.4/ 100
METRIC RATING
173rd/ 347
METRIC RANK
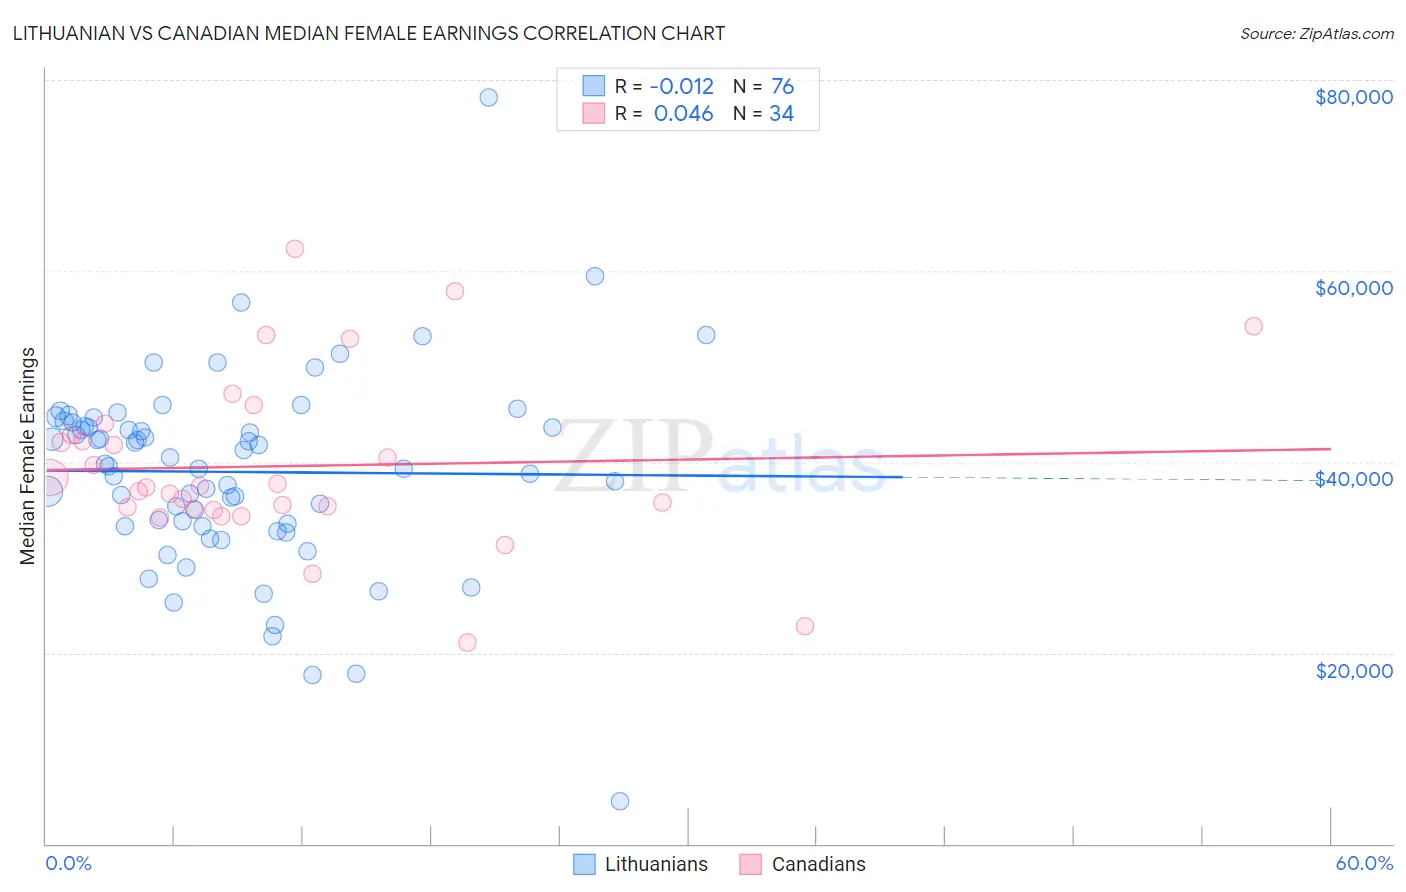
Lithuanian vs Canadian Median Female Earnings Correlation Chart
The statistical analysis conducted on geographies consisting of 421,690,318 people shows no correlation between the proportion of Lithuanians and median female earnings in the United States with a correlation coefficient (R) of -0.012 and weighted average of $42,108. Similarly, the statistical analysis conducted on geographies consisting of 437,261,658 people shows no correlation between the proportion of Canadians and median female earnings in the United States with a correlation coefficient (R) of 0.046 and weighted average of $39,724, a difference of 6.0%.
Median Female Earnings Correlation Summary
| Measurement | Lithuanian | Canadian |
| Minimum | $4,435 | $21,111 |
| Maximum | $78,167 | $62,276 |
| Range | $73,732 | $41,165 |
| Mean | $38,946 | $39,561 |
| Median | $39,620 | $37,391 |
| Interquartile 25% (IQ1) | $33,413 | $35,143 |
| Interquartile 75% (IQ3) | $43,909 | $42,841 |
| Interquartile Range (IQR) | $10,496 | $7,698 |
| Standard Deviation (Sample) | $10,262 | $8,927 |
| Standard Deviation (Population) | $10,194 | $8,795 |
Similar Demographics by Median Female Earnings
Demographics Similar to Lithuanians by Median Female Earnings
In terms of median female earnings, the demographic groups most similar to Lithuanians are Immigrants from St. Vincent and the Grenadines ($42,108, a difference of 0.0%), Laotian ($42,133, a difference of 0.060%), Immigrants from Northern Africa ($42,084, a difference of 0.060%), Immigrants from Afghanistan ($42,055, a difference of 0.12%), and Ukrainian ($42,015, a difference of 0.22%).
| Demographics | Rating | Rank | Median Female Earnings |
| Immigrants | Moldova | 99.6 /100 | #80 | Exceptional $42,304 |
| Immigrants | Southern Europe | 99.5 /100 | #81 | Exceptional $42,275 |
| Immigrants | Morocco | 99.5 /100 | #82 | Exceptional $42,229 |
| Immigrants | Sierra Leone | 99.5 /100 | #83 | Exceptional $42,214 |
| Armenians | 99.5 /100 | #84 | Exceptional $42,212 |
| Laotians | 99.4 /100 | #85 | Exceptional $42,133 |
| Immigrants | St. Vincent and the Grenadines | 99.3 /100 | #86 | Exceptional $42,108 |
| Lithuanians | 99.3 /100 | #87 | Exceptional $42,108 |
| Immigrants | Northern Africa | 99.3 /100 | #88 | Exceptional $42,084 |
| Immigrants | Afghanistan | 99.3 /100 | #89 | Exceptional $42,055 |
| Ukrainians | 99.2 /100 | #90 | Exceptional $42,015 |
| Immigrants | Western Europe | 99.2 /100 | #91 | Exceptional $41,990 |
| Argentineans | 99.1 /100 | #92 | Exceptional $41,952 |
| Immigrants | Grenada | 99.0 /100 | #93 | Exceptional $41,932 |
| Moroccans | 98.9 /100 | #94 | Exceptional $41,872 |
Demographics Similar to Canadians by Median Female Earnings
In terms of median female earnings, the demographic groups most similar to Canadians are South American ($39,698, a difference of 0.070%), British ($39,772, a difference of 0.12%), Immigrants from Portugal ($39,788, a difference of 0.16%), Immigrants from South America ($39,643, a difference of 0.20%), and Nigerian ($39,641, a difference of 0.21%).
| Demographics | Rating | Rank | Median Female Earnings |
| Immigrants | Ghana | 60.0 /100 | #166 | Good $39,894 |
| Luxembourgers | 59.9 /100 | #167 | Average $39,891 |
| Immigrants | Peru | 58.9 /100 | #168 | Average $39,871 |
| Kenyans | 58.4 /100 | #169 | Average $39,860 |
| Slovenes | 56.2 /100 | #170 | Average $39,817 |
| Immigrants | Portugal | 54.7 /100 | #171 | Average $39,788 |
| British | 53.8 /100 | #172 | Average $39,772 |
| Canadians | 51.4 /100 | #173 | Average $39,724 |
| South Americans | 50.0 /100 | #174 | Average $39,698 |
| Immigrants | South America | 47.2 /100 | #175 | Average $39,643 |
| Nigerians | 47.0 /100 | #176 | Average $39,641 |
| Costa Ricans | 46.1 /100 | #177 | Average $39,622 |
| Slavs | 45.6 /100 | #178 | Average $39,613 |
| Immigrants | Germany | 45.1 /100 | #179 | Average $39,603 |
| Immigrants | Kenya | 41.6 /100 | #180 | Average $39,535 |