Pakistani vs Immigrants from Sri Lanka Median Female Earnings
COMPARE
Pakistani
Immigrants from Sri Lanka
Median Female Earnings
Median Female Earnings Comparison
Pakistanis
Immigrants from Sri Lanka
$40,596
MEDIAN FEMALE EARNINGS
86.6/ 100
METRIC RATING
137th/ 347
METRIC RANK
$44,161
MEDIAN FEMALE EARNINGS
100.0/ 100
METRIC RATING
35th/ 347
METRIC RANK
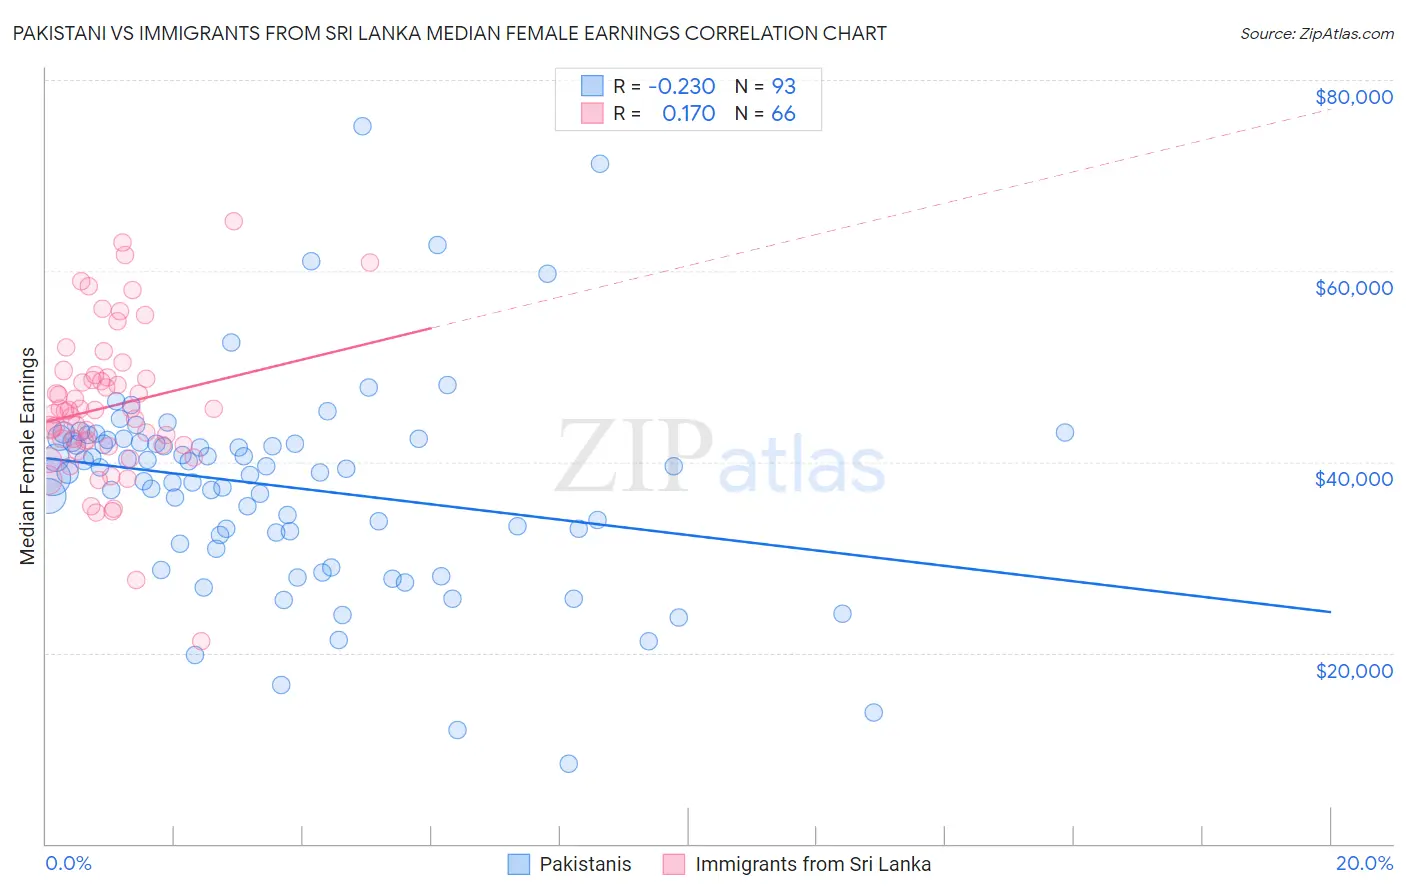
Pakistani vs Immigrants from Sri Lanka Median Female Earnings Correlation Chart
The statistical analysis conducted on geographies consisting of 335,277,808 people shows a weak negative correlation between the proportion of Pakistanis and median female earnings in the United States with a correlation coefficient (R) of -0.230 and weighted average of $40,596. Similarly, the statistical analysis conducted on geographies consisting of 149,683,911 people shows a poor positive correlation between the proportion of Immigrants from Sri Lanka and median female earnings in the United States with a correlation coefficient (R) of 0.170 and weighted average of $44,161, a difference of 8.8%.
Median Female Earnings Correlation Summary
| Measurement | Pakistani | Immigrants from Sri Lanka |
| Minimum | $8,380 | $21,250 |
| Maximum | $75,132 | $65,169 |
| Range | $66,752 | $43,919 |
| Mean | $37,425 | $45,787 |
| Median | $38,904 | $45,387 |
| Interquartile 25% (IQ1) | $31,921 | $41,731 |
| Interquartile 75% (IQ3) | $42,191 | $48,786 |
| Interquartile Range (IQR) | $10,270 | $7,055 |
| Standard Deviation (Sample) | $10,860 | $7,939 |
| Standard Deviation (Population) | $10,802 | $7,878 |
Similar Demographics by Median Female Earnings
Demographics Similar to Pakistanis by Median Female Earnings
In terms of median female earnings, the demographic groups most similar to Pakistanis are Taiwanese ($40,576, a difference of 0.050%), Immigrants from South Eastern Asia ($40,558, a difference of 0.090%), Immigrants from Eastern Africa ($40,644, a difference of 0.12%), Serbian ($40,539, a difference of 0.14%), and Immigrants from Syria ($40,499, a difference of 0.24%).
| Demographics | Rating | Rank | Median Female Earnings |
| Immigrants | Guyana | 90.3 /100 | #130 | Exceptional $40,773 |
| Chileans | 90.0 /100 | #131 | Exceptional $40,757 |
| Immigrants | Uganda | 89.7 /100 | #132 | Excellent $40,739 |
| Syrians | 89.5 /100 | #133 | Excellent $40,727 |
| Arabs | 89.3 /100 | #134 | Excellent $40,718 |
| Immigrants | Nepal | 89.0 /100 | #135 | Excellent $40,704 |
| Immigrants | Eastern Africa | 87.7 /100 | #136 | Excellent $40,644 |
| Pakistanis | 86.6 /100 | #137 | Excellent $40,596 |
| Taiwanese | 86.1 /100 | #138 | Excellent $40,576 |
| Immigrants | South Eastern Asia | 85.7 /100 | #139 | Excellent $40,558 |
| Serbians | 85.2 /100 | #140 | Excellent $40,539 |
| Immigrants | Syria | 84.1 /100 | #141 | Excellent $40,499 |
| Sri Lankans | 84.0 /100 | #142 | Excellent $40,496 |
| Northern Europeans | 83.9 /100 | #143 | Excellent $40,491 |
| Immigrants | North Macedonia | 83.8 /100 | #144 | Excellent $40,488 |
Demographics Similar to Immigrants from Sri Lanka by Median Female Earnings
In terms of median female earnings, the demographic groups most similar to Immigrants from Sri Lanka are Russian ($44,169, a difference of 0.020%), Immigrants from Asia ($44,198, a difference of 0.080%), Immigrants from Turkey ($44,066, a difference of 0.21%), Immigrants from Switzerland ($43,996, a difference of 0.37%), and Immigrants from Northern Europe ($44,366, a difference of 0.46%).
| Demographics | Rating | Rank | Median Female Earnings |
| Immigrants | Russia | 100.0 /100 | #28 | Exceptional $44,680 |
| Immigrants | Belgium | 100.0 /100 | #29 | Exceptional $44,587 |
| Asians | 100.0 /100 | #30 | Exceptional $44,586 |
| Immigrants | France | 100.0 /100 | #31 | Exceptional $44,541 |
| Immigrants | Northern Europe | 100.0 /100 | #32 | Exceptional $44,366 |
| Immigrants | Asia | 100.0 /100 | #33 | Exceptional $44,198 |
| Russians | 100.0 /100 | #34 | Exceptional $44,169 |
| Immigrants | Sri Lanka | 100.0 /100 | #35 | Exceptional $44,161 |
| Immigrants | Turkey | 100.0 /100 | #36 | Exceptional $44,066 |
| Immigrants | Switzerland | 100.0 /100 | #37 | Exceptional $43,996 |
| Latvians | 100.0 /100 | #38 | Exceptional $43,941 |
| Israelis | 100.0 /100 | #39 | Exceptional $43,852 |
| Immigrants | Malaysia | 100.0 /100 | #40 | Exceptional $43,835 |
| Bhutanese | 100.0 /100 | #41 | Exceptional $43,648 |
| Immigrants | Denmark | 100.0 /100 | #42 | Exceptional $43,646 |