Immigrants from Armenia vs Canadian Median Female Earnings
COMPARE
Immigrants from Armenia
Canadian
Median Female Earnings
Median Female Earnings Comparison
Immigrants from Armenia
Canadians
$40,340
MEDIAN FEMALE EARNINGS
79.2/ 100
METRIC RATING
151st/ 347
METRIC RANK
$39,724
MEDIAN FEMALE EARNINGS
51.4/ 100
METRIC RATING
173rd/ 347
METRIC RANK
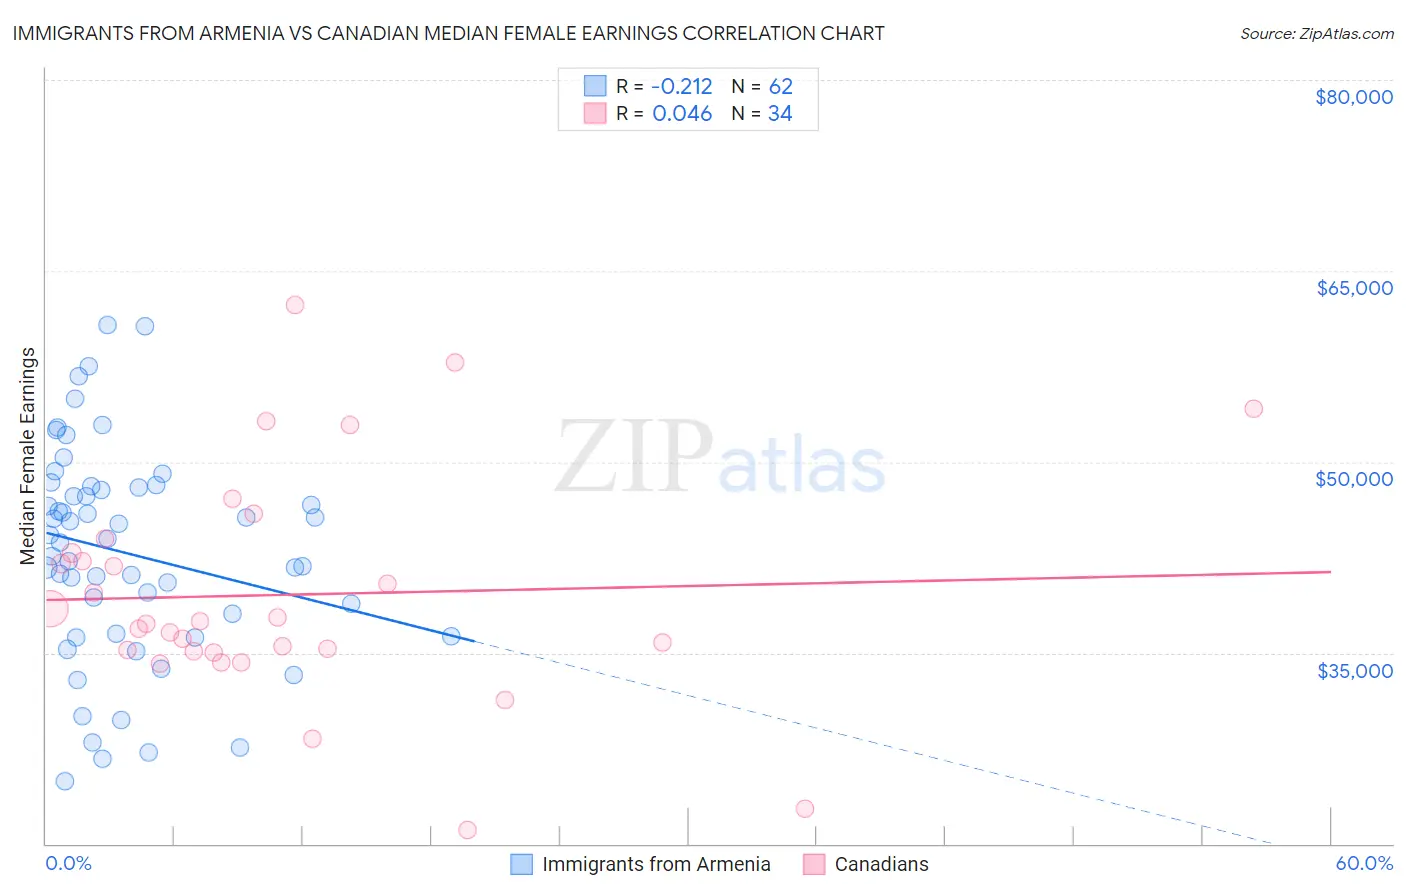
Immigrants from Armenia vs Canadian Median Female Earnings Correlation Chart
The statistical analysis conducted on geographies consisting of 97,714,677 people shows a weak negative correlation between the proportion of Immigrants from Armenia and median female earnings in the United States with a correlation coefficient (R) of -0.212 and weighted average of $40,340. Similarly, the statistical analysis conducted on geographies consisting of 437,261,658 people shows no correlation between the proportion of Canadians and median female earnings in the United States with a correlation coefficient (R) of 0.046 and weighted average of $39,724, a difference of 1.5%.
Median Female Earnings Correlation Summary
| Measurement | Immigrants from Armenia | Canadian |
| Minimum | $24,884 | $21,111 |
| Maximum | $60,766 | $62,276 |
| Range | $35,882 | $41,165 |
| Mean | $42,818 | $39,561 |
| Median | $43,807 | $37,391 |
| Interquartile 25% (IQ1) | $36,510 | $35,143 |
| Interquartile 75% (IQ3) | $47,965 | $42,841 |
| Interquartile Range (IQR) | $11,455 | $7,698 |
| Standard Deviation (Sample) | $8,342 | $8,927 |
| Standard Deviation (Population) | $8,274 | $8,795 |
Similar Demographics by Median Female Earnings
Demographics Similar to Immigrants from Armenia by Median Female Earnings
In terms of median female earnings, the demographic groups most similar to Immigrants from Armenia are Immigrants from Cameroon ($40,354, a difference of 0.030%), Immigrants from Chile ($40,353, a difference of 0.030%), West Indian ($40,317, a difference of 0.060%), Polish ($40,371, a difference of 0.080%), and Vietnamese ($40,377, a difference of 0.090%).
| Demographics | Rating | Rank | Median Female Earnings |
| Immigrants | North Macedonia | 83.8 /100 | #144 | Excellent $40,488 |
| Brazilians | 83.6 /100 | #145 | Excellent $40,483 |
| Ghanaians | 82.1 /100 | #146 | Excellent $40,429 |
| Vietnamese | 80.4 /100 | #147 | Excellent $40,377 |
| Poles | 80.2 /100 | #148 | Excellent $40,371 |
| Immigrants | Cameroon | 79.7 /100 | #149 | Good $40,354 |
| Immigrants | Chile | 79.6 /100 | #150 | Good $40,353 |
| Immigrants | Armenia | 79.2 /100 | #151 | Good $40,340 |
| West Indians | 78.4 /100 | #152 | Good $40,317 |
| British West Indians | 77.7 /100 | #153 | Good $40,299 |
| Immigrants | Oceania | 77.6 /100 | #154 | Good $40,297 |
| Immigrants | Africa | 76.2 /100 | #155 | Good $40,257 |
| Peruvians | 75.3 /100 | #156 | Good $40,234 |
| Portuguese | 73.0 /100 | #157 | Good $40,177 |
| Immigrants | Senegal | 72.2 /100 | #158 | Good $40,157 |
Demographics Similar to Canadians by Median Female Earnings
In terms of median female earnings, the demographic groups most similar to Canadians are South American ($39,698, a difference of 0.070%), British ($39,772, a difference of 0.12%), Immigrants from Portugal ($39,788, a difference of 0.16%), Immigrants from South America ($39,643, a difference of 0.20%), and Nigerian ($39,641, a difference of 0.21%).
| Demographics | Rating | Rank | Median Female Earnings |
| Immigrants | Ghana | 60.0 /100 | #166 | Good $39,894 |
| Luxembourgers | 59.9 /100 | #167 | Average $39,891 |
| Immigrants | Peru | 58.9 /100 | #168 | Average $39,871 |
| Kenyans | 58.4 /100 | #169 | Average $39,860 |
| Slovenes | 56.2 /100 | #170 | Average $39,817 |
| Immigrants | Portugal | 54.7 /100 | #171 | Average $39,788 |
| British | 53.8 /100 | #172 | Average $39,772 |
| Canadians | 51.4 /100 | #173 | Average $39,724 |
| South Americans | 50.0 /100 | #174 | Average $39,698 |
| Immigrants | South America | 47.2 /100 | #175 | Average $39,643 |
| Nigerians | 47.0 /100 | #176 | Average $39,641 |
| Costa Ricans | 46.1 /100 | #177 | Average $39,622 |
| Slavs | 45.6 /100 | #178 | Average $39,613 |
| Immigrants | Germany | 45.1 /100 | #179 | Average $39,603 |
| Immigrants | Kenya | 41.6 /100 | #180 | Average $39,535 |