Pakistani vs Maltese Median Female Earnings
COMPARE
Pakistani
Maltese
Median Female Earnings
Median Female Earnings Comparison
Pakistanis
Maltese
$40,596
MEDIAN FEMALE EARNINGS
86.6/ 100
METRIC RATING
137th/ 347
METRIC RANK
$43,357
MEDIAN FEMALE EARNINGS
100.0/ 100
METRIC RATING
51st/ 347
METRIC RANK
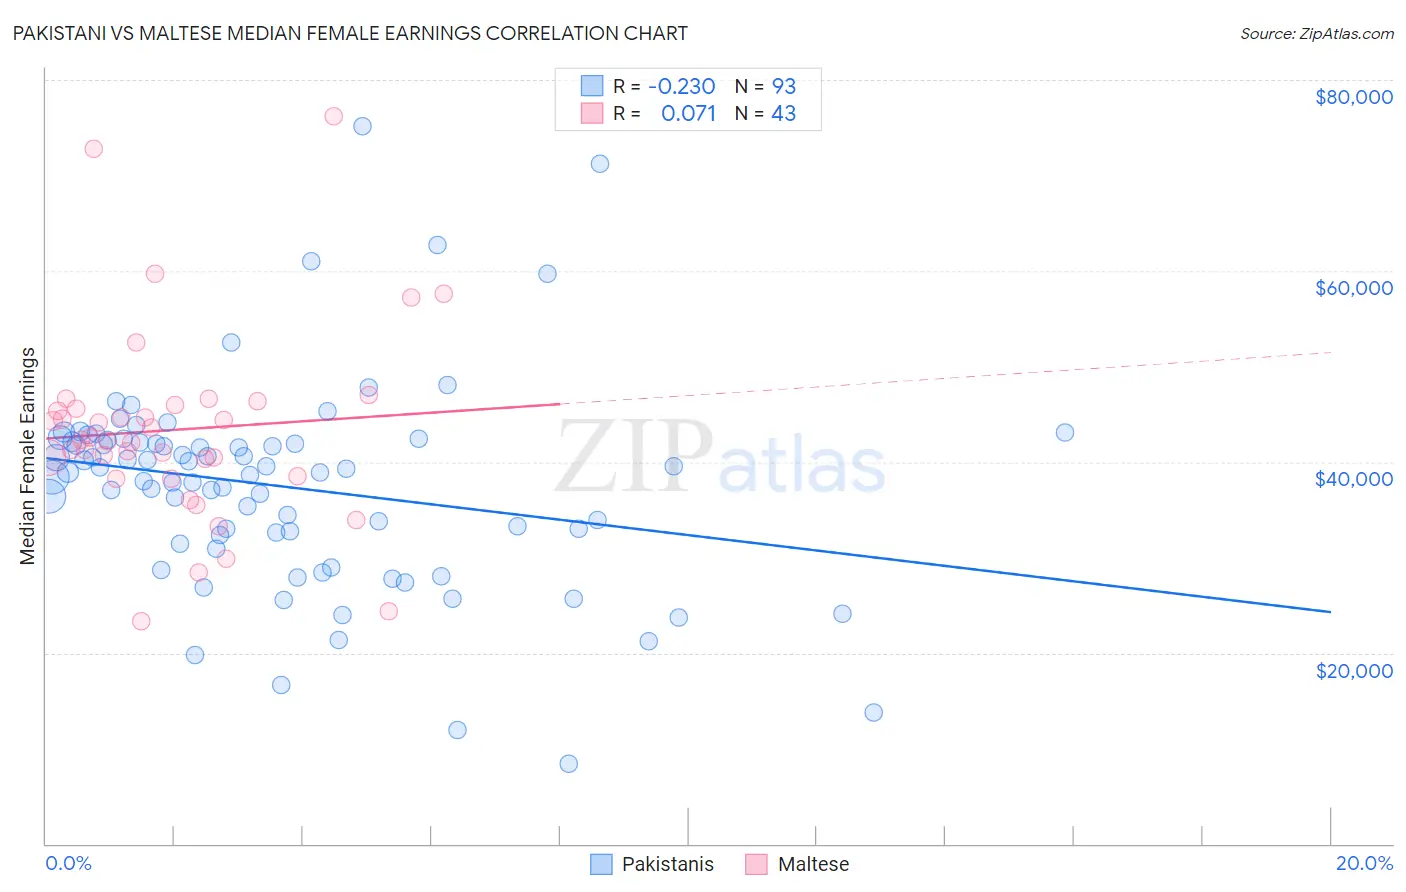
Pakistani vs Maltese Median Female Earnings Correlation Chart
The statistical analysis conducted on geographies consisting of 335,277,808 people shows a weak negative correlation between the proportion of Pakistanis and median female earnings in the United States with a correlation coefficient (R) of -0.230 and weighted average of $40,596. Similarly, the statistical analysis conducted on geographies consisting of 126,447,525 people shows a slight positive correlation between the proportion of Maltese and median female earnings in the United States with a correlation coefficient (R) of 0.071 and weighted average of $43,357, a difference of 6.8%.
Median Female Earnings Correlation Summary
| Measurement | Pakistani | Maltese |
| Minimum | $8,380 | $23,250 |
| Maximum | $75,132 | $76,250 |
| Range | $66,752 | $53,000 |
| Mean | $37,425 | $43,370 |
| Median | $38,904 | $42,338 |
| Interquartile 25% (IQ1) | $31,921 | $38,447 |
| Interquartile 75% (IQ3) | $42,191 | $45,921 |
| Interquartile Range (IQR) | $10,270 | $7,474 |
| Standard Deviation (Sample) | $10,860 | $10,204 |
| Standard Deviation (Population) | $10,802 | $10,085 |
Similar Demographics by Median Female Earnings
Demographics Similar to Pakistanis by Median Female Earnings
In terms of median female earnings, the demographic groups most similar to Pakistanis are Taiwanese ($40,576, a difference of 0.050%), Immigrants from South Eastern Asia ($40,558, a difference of 0.090%), Immigrants from Eastern Africa ($40,644, a difference of 0.12%), Serbian ($40,539, a difference of 0.14%), and Immigrants from Syria ($40,499, a difference of 0.24%).
| Demographics | Rating | Rank | Median Female Earnings |
| Immigrants | Guyana | 90.3 /100 | #130 | Exceptional $40,773 |
| Chileans | 90.0 /100 | #131 | Exceptional $40,757 |
| Immigrants | Uganda | 89.7 /100 | #132 | Excellent $40,739 |
| Syrians | 89.5 /100 | #133 | Excellent $40,727 |
| Arabs | 89.3 /100 | #134 | Excellent $40,718 |
| Immigrants | Nepal | 89.0 /100 | #135 | Excellent $40,704 |
| Immigrants | Eastern Africa | 87.7 /100 | #136 | Excellent $40,644 |
| Pakistanis | 86.6 /100 | #137 | Excellent $40,596 |
| Taiwanese | 86.1 /100 | #138 | Excellent $40,576 |
| Immigrants | South Eastern Asia | 85.7 /100 | #139 | Excellent $40,558 |
| Serbians | 85.2 /100 | #140 | Excellent $40,539 |
| Immigrants | Syria | 84.1 /100 | #141 | Excellent $40,499 |
| Sri Lankans | 84.0 /100 | #142 | Excellent $40,496 |
| Northern Europeans | 83.9 /100 | #143 | Excellent $40,491 |
| Immigrants | North Macedonia | 83.8 /100 | #144 | Excellent $40,488 |
Demographics Similar to Maltese by Median Female Earnings
In terms of median female earnings, the demographic groups most similar to Maltese are Immigrants from Uzbekistan ($43,363, a difference of 0.010%), Immigrants from Serbia ($43,385, a difference of 0.060%), Immigrants from Lithuania ($43,317, a difference of 0.090%), Immigrants from Eastern Europe ($43,309, a difference of 0.11%), and Australian ($43,308, a difference of 0.11%).
| Demographics | Rating | Rank | Median Female Earnings |
| Immigrants | Czechoslovakia | 100.0 /100 | #44 | Exceptional $43,571 |
| Immigrants | Europe | 100.0 /100 | #45 | Exceptional $43,523 |
| Immigrants | Bolivia | 100.0 /100 | #46 | Exceptional $43,467 |
| Bolivians | 100.0 /100 | #47 | Exceptional $43,445 |
| Immigrants | Indonesia | 100.0 /100 | #48 | Exceptional $43,412 |
| Immigrants | Serbia | 100.0 /100 | #49 | Exceptional $43,385 |
| Immigrants | Uzbekistan | 100.0 /100 | #50 | Exceptional $43,363 |
| Maltese | 100.0 /100 | #51 | Exceptional $43,357 |
| Immigrants | Lithuania | 99.9 /100 | #52 | Exceptional $43,317 |
| Immigrants | Eastern Europe | 99.9 /100 | #53 | Exceptional $43,309 |
| Australians | 99.9 /100 | #54 | Exceptional $43,308 |
| Egyptians | 99.9 /100 | #55 | Exceptional $43,305 |
| Immigrants | Croatia | 99.9 /100 | #56 | Exceptional $43,258 |
| Ethiopians | 99.9 /100 | #57 | Exceptional $43,243 |
| Paraguayans | 99.9 /100 | #58 | Exceptional $43,173 |