Burmese vs Canadian Median Female Earnings
COMPARE
Burmese
Canadian
Median Female Earnings
Median Female Earnings Comparison
Burmese
Canadians
$44,911
MEDIAN FEMALE EARNINGS
100.0/ 100
METRIC RATING
23rd/ 347
METRIC RANK
$39,724
MEDIAN FEMALE EARNINGS
51.4/ 100
METRIC RATING
173rd/ 347
METRIC RANK
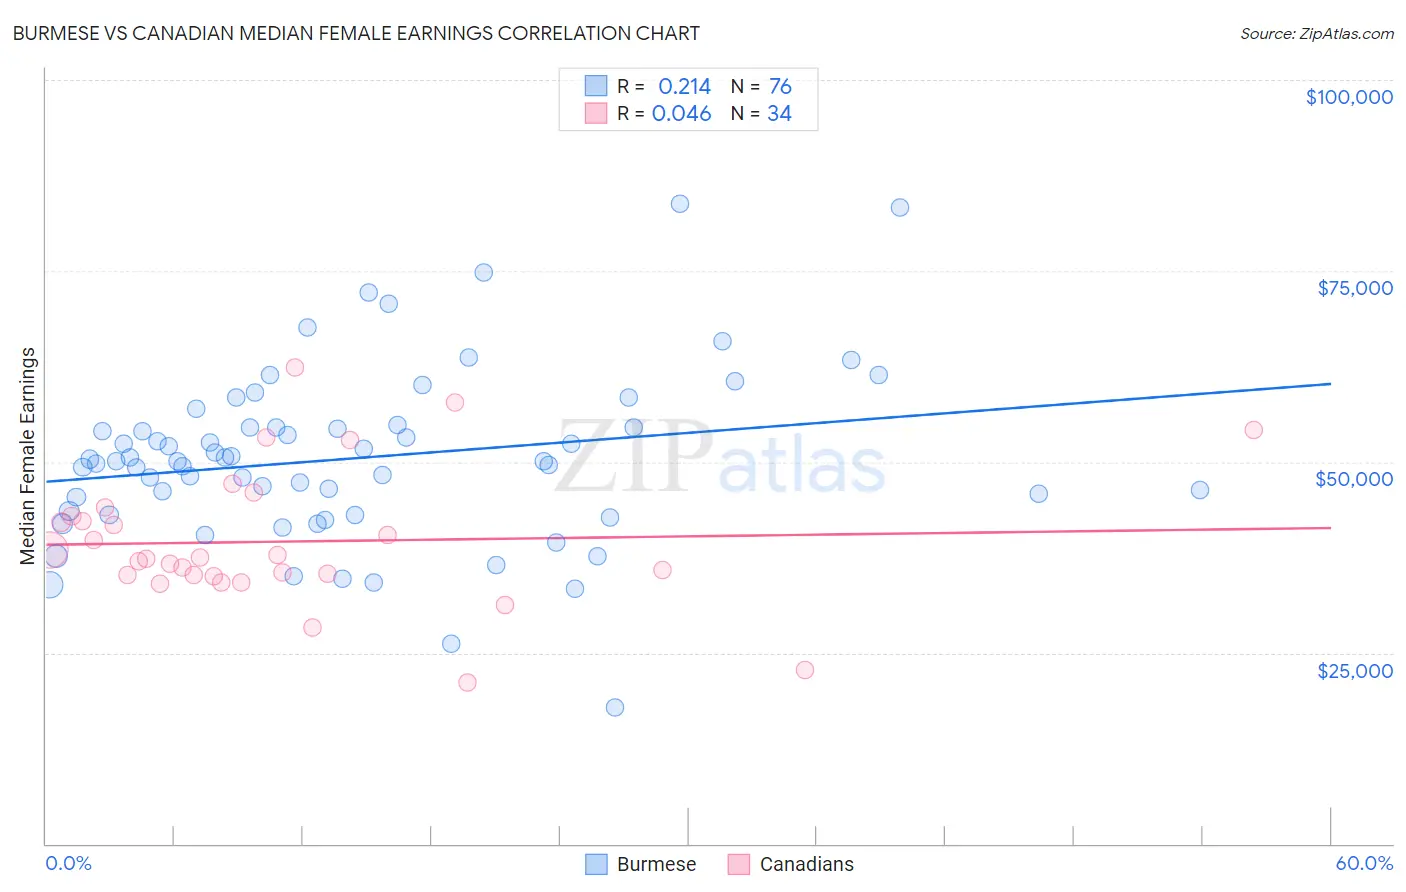
Burmese vs Canadian Median Female Earnings Correlation Chart
The statistical analysis conducted on geographies consisting of 465,115,174 people shows a weak positive correlation between the proportion of Burmese and median female earnings in the United States with a correlation coefficient (R) of 0.214 and weighted average of $44,911. Similarly, the statistical analysis conducted on geographies consisting of 437,261,658 people shows no correlation between the proportion of Canadians and median female earnings in the United States with a correlation coefficient (R) of 0.046 and weighted average of $39,724, a difference of 13.1%.
Median Female Earnings Correlation Summary
| Measurement | Burmese | Canadian |
| Minimum | $17,769 | $21,111 |
| Maximum | $83,750 | $62,276 |
| Range | $65,981 | $41,165 |
| Mean | $50,485 | $39,561 |
| Median | $50,131 | $37,391 |
| Interquartile 25% (IQ1) | $43,337 | $35,143 |
| Interquartile 75% (IQ3) | $54,499 | $42,841 |
| Interquartile Range (IQR) | $11,162 | $7,698 |
| Standard Deviation (Sample) | $11,391 | $8,927 |
| Standard Deviation (Population) | $11,316 | $8,795 |
Similar Demographics by Median Female Earnings
Demographics Similar to Burmese by Median Female Earnings
In terms of median female earnings, the demographic groups most similar to Burmese are Immigrants from Greece ($44,976, a difference of 0.14%), Immigrants from Korea ($44,847, a difference of 0.14%), Cambodian ($45,014, a difference of 0.23%), Immigrants from Sweden ($44,774, a difference of 0.31%), and Immigrants from Belarus ($44,757, a difference of 0.34%).
| Demographics | Rating | Rank | Median Female Earnings |
| Indians (Asian) | 100.0 /100 | #16 | Exceptional $46,481 |
| Immigrants | South Central Asia | 100.0 /100 | #17 | Exceptional $46,324 |
| Cypriots | 100.0 /100 | #18 | Exceptional $45,570 |
| Eastern Europeans | 100.0 /100 | #19 | Exceptional $45,385 |
| Immigrants | Japan | 100.0 /100 | #20 | Exceptional $45,323 |
| Cambodians | 100.0 /100 | #21 | Exceptional $45,014 |
| Immigrants | Greece | 100.0 /100 | #22 | Exceptional $44,976 |
| Burmese | 100.0 /100 | #23 | Exceptional $44,911 |
| Immigrants | Korea | 100.0 /100 | #24 | Exceptional $44,847 |
| Immigrants | Sweden | 100.0 /100 | #25 | Exceptional $44,774 |
| Immigrants | Belarus | 100.0 /100 | #26 | Exceptional $44,757 |
| Turks | 100.0 /100 | #27 | Exceptional $44,695 |
| Immigrants | Russia | 100.0 /100 | #28 | Exceptional $44,680 |
| Immigrants | Belgium | 100.0 /100 | #29 | Exceptional $44,587 |
| Asians | 100.0 /100 | #30 | Exceptional $44,586 |
Demographics Similar to Canadians by Median Female Earnings
In terms of median female earnings, the demographic groups most similar to Canadians are South American ($39,698, a difference of 0.070%), British ($39,772, a difference of 0.12%), Immigrants from Portugal ($39,788, a difference of 0.16%), Immigrants from South America ($39,643, a difference of 0.20%), and Nigerian ($39,641, a difference of 0.21%).
| Demographics | Rating | Rank | Median Female Earnings |
| Immigrants | Ghana | 60.0 /100 | #166 | Good $39,894 |
| Luxembourgers | 59.9 /100 | #167 | Average $39,891 |
| Immigrants | Peru | 58.9 /100 | #168 | Average $39,871 |
| Kenyans | 58.4 /100 | #169 | Average $39,860 |
| Slovenes | 56.2 /100 | #170 | Average $39,817 |
| Immigrants | Portugal | 54.7 /100 | #171 | Average $39,788 |
| British | 53.8 /100 | #172 | Average $39,772 |
| Canadians | 51.4 /100 | #173 | Average $39,724 |
| South Americans | 50.0 /100 | #174 | Average $39,698 |
| Immigrants | South America | 47.2 /100 | #175 | Average $39,643 |
| Nigerians | 47.0 /100 | #176 | Average $39,641 |
| Costa Ricans | 46.1 /100 | #177 | Average $39,622 |
| Slavs | 45.6 /100 | #178 | Average $39,613 |
| Immigrants | Germany | 45.1 /100 | #179 | Average $39,603 |
| Immigrants | Kenya | 41.6 /100 | #180 | Average $39,535 |