Pakistani vs Swiss Median Female Earnings
COMPARE
Pakistani
Swiss
Median Female Earnings
Median Female Earnings Comparison
Pakistanis
Swiss
$40,596
MEDIAN FEMALE EARNINGS
86.6/ 100
METRIC RATING
137th/ 347
METRIC RANK
$37,904
MEDIAN FEMALE EARNINGS
2.3/ 100
METRIC RATING
249th/ 347
METRIC RANK
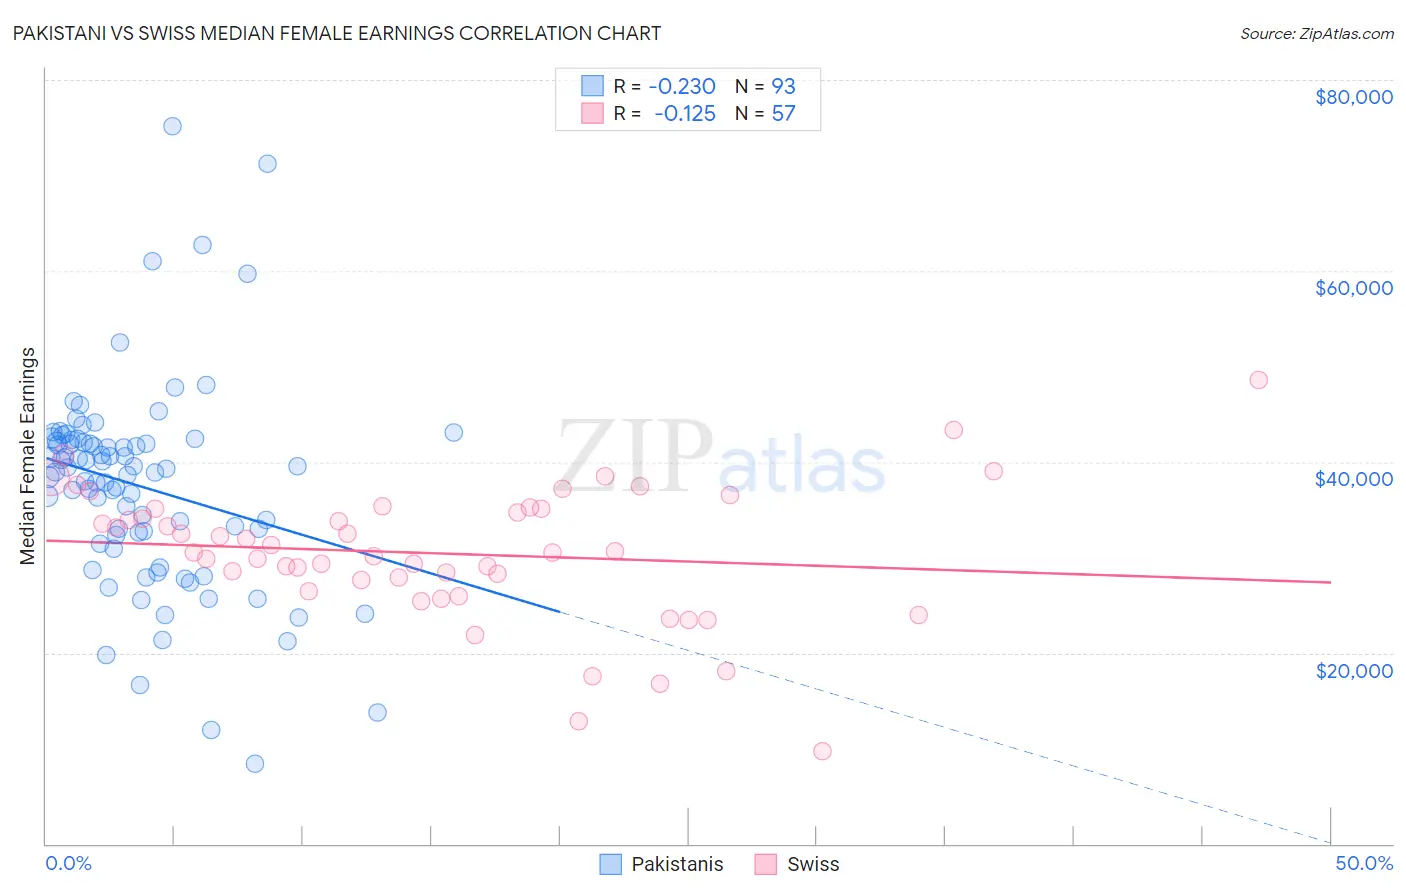
Pakistani vs Swiss Median Female Earnings Correlation Chart
The statistical analysis conducted on geographies consisting of 335,277,808 people shows a weak negative correlation between the proportion of Pakistanis and median female earnings in the United States with a correlation coefficient (R) of -0.230 and weighted average of $40,596. Similarly, the statistical analysis conducted on geographies consisting of 464,484,716 people shows a poor negative correlation between the proportion of Swiss and median female earnings in the United States with a correlation coefficient (R) of -0.125 and weighted average of $37,904, a difference of 7.1%.
Median Female Earnings Correlation Summary
| Measurement | Pakistani | Swiss |
| Minimum | $8,380 | $9,649 |
| Maximum | $75,132 | $48,533 |
| Range | $66,752 | $38,884 |
| Mean | $37,425 | $30,422 |
| Median | $38,904 | $30,468 |
| Interquartile 25% (IQ1) | $31,921 | $27,075 |
| Interquartile 75% (IQ3) | $42,191 | $35,111 |
| Interquartile Range (IQR) | $10,270 | $8,036 |
| Standard Deviation (Sample) | $10,860 | $7,120 |
| Standard Deviation (Population) | $10,802 | $7,057 |
Similar Demographics by Median Female Earnings
Demographics Similar to Pakistanis by Median Female Earnings
In terms of median female earnings, the demographic groups most similar to Pakistanis are Taiwanese ($40,576, a difference of 0.050%), Immigrants from South Eastern Asia ($40,558, a difference of 0.090%), Immigrants from Eastern Africa ($40,644, a difference of 0.12%), Serbian ($40,539, a difference of 0.14%), and Immigrants from Syria ($40,499, a difference of 0.24%).
| Demographics | Rating | Rank | Median Female Earnings |
| Immigrants | Guyana | 90.3 /100 | #130 | Exceptional $40,773 |
| Chileans | 90.0 /100 | #131 | Exceptional $40,757 |
| Immigrants | Uganda | 89.7 /100 | #132 | Excellent $40,739 |
| Syrians | 89.5 /100 | #133 | Excellent $40,727 |
| Arabs | 89.3 /100 | #134 | Excellent $40,718 |
| Immigrants | Nepal | 89.0 /100 | #135 | Excellent $40,704 |
| Immigrants | Eastern Africa | 87.7 /100 | #136 | Excellent $40,644 |
| Pakistanis | 86.6 /100 | #137 | Excellent $40,596 |
| Taiwanese | 86.1 /100 | #138 | Excellent $40,576 |
| Immigrants | South Eastern Asia | 85.7 /100 | #139 | Excellent $40,558 |
| Serbians | 85.2 /100 | #140 | Excellent $40,539 |
| Immigrants | Syria | 84.1 /100 | #141 | Excellent $40,499 |
| Sri Lankans | 84.0 /100 | #142 | Excellent $40,496 |
| Northern Europeans | 83.9 /100 | #143 | Excellent $40,491 |
| Immigrants | North Macedonia | 83.8 /100 | #144 | Excellent $40,488 |
Demographics Similar to Swiss by Median Female Earnings
In terms of median female earnings, the demographic groups most similar to Swiss are Alaskan Athabascan ($37,905, a difference of 0.0%), Immigrants from Somalia ($37,914, a difference of 0.030%), Immigrants from Iraq ($37,864, a difference of 0.11%), Welsh ($37,856, a difference of 0.13%), and Immigrants from Middle Africa ($37,965, a difference of 0.16%).
| Demographics | Rating | Rank | Median Female Earnings |
| Immigrants | Burma/Myanmar | 3.0 /100 | #242 | Tragic $38,028 |
| Germans | 2.8 /100 | #243 | Tragic $37,986 |
| Immigrants | Liberia | 2.7 /100 | #244 | Tragic $37,970 |
| Immigrants | Middle Africa | 2.7 /100 | #245 | Tragic $37,965 |
| Delaware | 2.6 /100 | #246 | Tragic $37,964 |
| Immigrants | Somalia | 2.4 /100 | #247 | Tragic $37,914 |
| Alaskan Athabascans | 2.3 /100 | #248 | Tragic $37,905 |
| Swiss | 2.3 /100 | #249 | Tragic $37,904 |
| Immigrants | Iraq | 2.2 /100 | #250 | Tragic $37,864 |
| Welsh | 2.1 /100 | #251 | Tragic $37,856 |
| Immigrants | Dominica | 2.0 /100 | #252 | Tragic $37,825 |
| Danes | 1.6 /100 | #253 | Tragic $37,730 |
| Whites/Caucasians | 1.1 /100 | #254 | Tragic $37,531 |
| Colville | 1.1 /100 | #255 | Tragic $37,514 |
| Samoans | 1.0 /100 | #256 | Tragic $37,498 |