Pakistani vs Lithuanian Median Female Earnings
COMPARE
Pakistani
Lithuanian
Median Female Earnings
Median Female Earnings Comparison
Pakistanis
Lithuanians
$40,596
MEDIAN FEMALE EARNINGS
86.6/ 100
METRIC RATING
137th/ 347
METRIC RANK
$42,108
MEDIAN FEMALE EARNINGS
99.3/ 100
METRIC RATING
87th/ 347
METRIC RANK
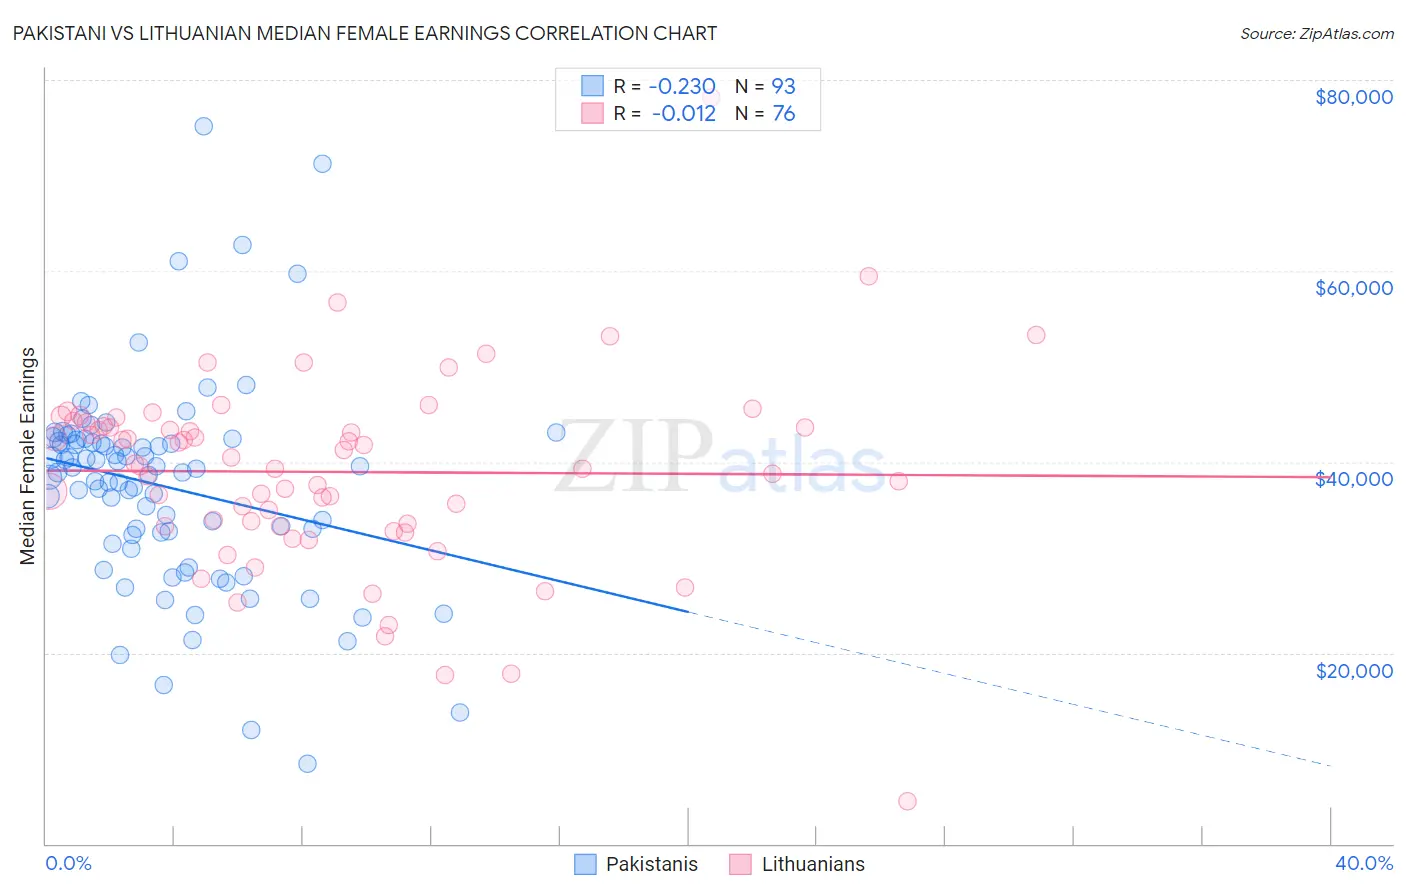
Pakistani vs Lithuanian Median Female Earnings Correlation Chart
The statistical analysis conducted on geographies consisting of 335,277,808 people shows a weak negative correlation between the proportion of Pakistanis and median female earnings in the United States with a correlation coefficient (R) of -0.230 and weighted average of $40,596. Similarly, the statistical analysis conducted on geographies consisting of 421,690,318 people shows no correlation between the proportion of Lithuanians and median female earnings in the United States with a correlation coefficient (R) of -0.012 and weighted average of $42,108, a difference of 3.7%.
Median Female Earnings Correlation Summary
| Measurement | Pakistani | Lithuanian |
| Minimum | $8,380 | $4,435 |
| Maximum | $75,132 | $78,167 |
| Range | $66,752 | $73,732 |
| Mean | $37,425 | $38,946 |
| Median | $38,904 | $39,620 |
| Interquartile 25% (IQ1) | $31,921 | $33,413 |
| Interquartile 75% (IQ3) | $42,191 | $43,909 |
| Interquartile Range (IQR) | $10,270 | $10,496 |
| Standard Deviation (Sample) | $10,860 | $10,262 |
| Standard Deviation (Population) | $10,802 | $10,194 |
Similar Demographics by Median Female Earnings
Demographics Similar to Pakistanis by Median Female Earnings
In terms of median female earnings, the demographic groups most similar to Pakistanis are Taiwanese ($40,576, a difference of 0.050%), Immigrants from South Eastern Asia ($40,558, a difference of 0.090%), Immigrants from Eastern Africa ($40,644, a difference of 0.12%), Serbian ($40,539, a difference of 0.14%), and Immigrants from Syria ($40,499, a difference of 0.24%).
| Demographics | Rating | Rank | Median Female Earnings |
| Immigrants | Guyana | 90.3 /100 | #130 | Exceptional $40,773 |
| Chileans | 90.0 /100 | #131 | Exceptional $40,757 |
| Immigrants | Uganda | 89.7 /100 | #132 | Excellent $40,739 |
| Syrians | 89.5 /100 | #133 | Excellent $40,727 |
| Arabs | 89.3 /100 | #134 | Excellent $40,718 |
| Immigrants | Nepal | 89.0 /100 | #135 | Excellent $40,704 |
| Immigrants | Eastern Africa | 87.7 /100 | #136 | Excellent $40,644 |
| Pakistanis | 86.6 /100 | #137 | Excellent $40,596 |
| Taiwanese | 86.1 /100 | #138 | Excellent $40,576 |
| Immigrants | South Eastern Asia | 85.7 /100 | #139 | Excellent $40,558 |
| Serbians | 85.2 /100 | #140 | Excellent $40,539 |
| Immigrants | Syria | 84.1 /100 | #141 | Excellent $40,499 |
| Sri Lankans | 84.0 /100 | #142 | Excellent $40,496 |
| Northern Europeans | 83.9 /100 | #143 | Excellent $40,491 |
| Immigrants | North Macedonia | 83.8 /100 | #144 | Excellent $40,488 |
Demographics Similar to Lithuanians by Median Female Earnings
In terms of median female earnings, the demographic groups most similar to Lithuanians are Immigrants from St. Vincent and the Grenadines ($42,108, a difference of 0.0%), Laotian ($42,133, a difference of 0.060%), Immigrants from Northern Africa ($42,084, a difference of 0.060%), Immigrants from Afghanistan ($42,055, a difference of 0.12%), and Ukrainian ($42,015, a difference of 0.22%).
| Demographics | Rating | Rank | Median Female Earnings |
| Immigrants | Moldova | 99.6 /100 | #80 | Exceptional $42,304 |
| Immigrants | Southern Europe | 99.5 /100 | #81 | Exceptional $42,275 |
| Immigrants | Morocco | 99.5 /100 | #82 | Exceptional $42,229 |
| Immigrants | Sierra Leone | 99.5 /100 | #83 | Exceptional $42,214 |
| Armenians | 99.5 /100 | #84 | Exceptional $42,212 |
| Laotians | 99.4 /100 | #85 | Exceptional $42,133 |
| Immigrants | St. Vincent and the Grenadines | 99.3 /100 | #86 | Exceptional $42,108 |
| Lithuanians | 99.3 /100 | #87 | Exceptional $42,108 |
| Immigrants | Northern Africa | 99.3 /100 | #88 | Exceptional $42,084 |
| Immigrants | Afghanistan | 99.3 /100 | #89 | Exceptional $42,055 |
| Ukrainians | 99.2 /100 | #90 | Exceptional $42,015 |
| Immigrants | Western Europe | 99.2 /100 | #91 | Exceptional $41,990 |
| Argentineans | 99.1 /100 | #92 | Exceptional $41,952 |
| Immigrants | Grenada | 99.0 /100 | #93 | Exceptional $41,932 |
| Moroccans | 98.9 /100 | #94 | Exceptional $41,872 |