Pakistani vs Native Hawaiian Median Female Earnings
COMPARE
Pakistani
Native Hawaiian
Median Female Earnings
Median Female Earnings Comparison
Pakistanis
Native Hawaiians
$40,596
MEDIAN FEMALE EARNINGS
86.6/ 100
METRIC RATING
137th/ 347
METRIC RANK
$38,461
MEDIAN FEMALE EARNINGS
7.1/ 100
METRIC RATING
224th/ 347
METRIC RANK
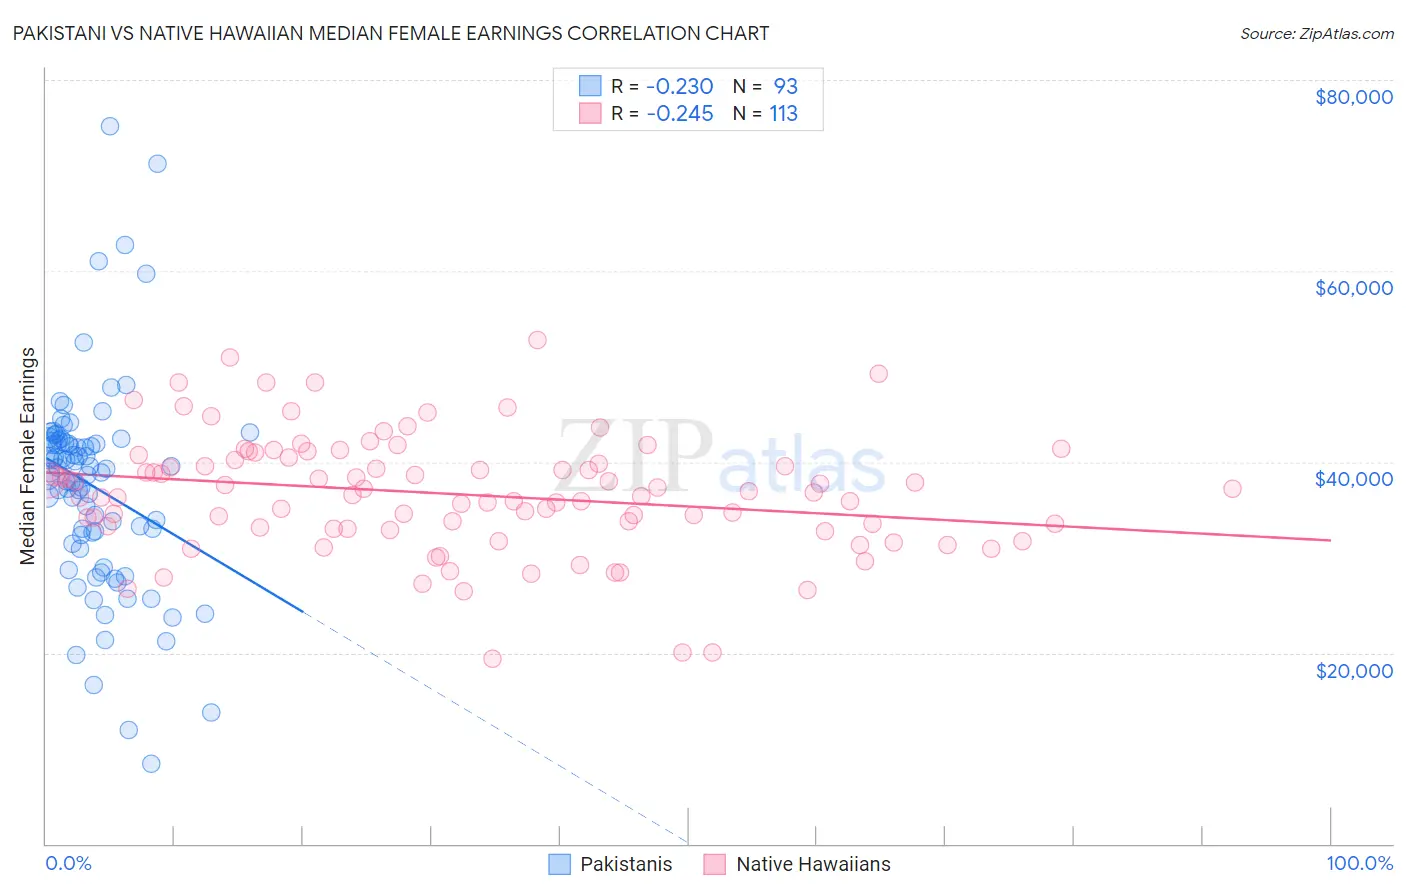
Pakistani vs Native Hawaiian Median Female Earnings Correlation Chart
The statistical analysis conducted on geographies consisting of 335,277,808 people shows a weak negative correlation between the proportion of Pakistanis and median female earnings in the United States with a correlation coefficient (R) of -0.230 and weighted average of $40,596. Similarly, the statistical analysis conducted on geographies consisting of 331,982,938 people shows a weak negative correlation between the proportion of Native Hawaiians and median female earnings in the United States with a correlation coefficient (R) of -0.245 and weighted average of $38,461, a difference of 5.6%.
Median Female Earnings Correlation Summary
| Measurement | Pakistani | Native Hawaiian |
| Minimum | $8,380 | $19,330 |
| Maximum | $75,132 | $52,779 |
| Range | $66,752 | $33,449 |
| Mean | $37,425 | $36,634 |
| Median | $38,904 | $36,735 |
| Interquartile 25% (IQ1) | $31,921 | $33,052 |
| Interquartile 75% (IQ3) | $42,191 | $40,312 |
| Interquartile Range (IQR) | $10,270 | $7,259 |
| Standard Deviation (Sample) | $10,860 | $6,153 |
| Standard Deviation (Population) | $10,802 | $6,125 |
Similar Demographics by Median Female Earnings
Demographics Similar to Pakistanis by Median Female Earnings
In terms of median female earnings, the demographic groups most similar to Pakistanis are Taiwanese ($40,576, a difference of 0.050%), Immigrants from South Eastern Asia ($40,558, a difference of 0.090%), Immigrants from Eastern Africa ($40,644, a difference of 0.12%), Serbian ($40,539, a difference of 0.14%), and Immigrants from Syria ($40,499, a difference of 0.24%).
| Demographics | Rating | Rank | Median Female Earnings |
| Immigrants | Guyana | 90.3 /100 | #130 | Exceptional $40,773 |
| Chileans | 90.0 /100 | #131 | Exceptional $40,757 |
| Immigrants | Uganda | 89.7 /100 | #132 | Excellent $40,739 |
| Syrians | 89.5 /100 | #133 | Excellent $40,727 |
| Arabs | 89.3 /100 | #134 | Excellent $40,718 |
| Immigrants | Nepal | 89.0 /100 | #135 | Excellent $40,704 |
| Immigrants | Eastern Africa | 87.7 /100 | #136 | Excellent $40,644 |
| Pakistanis | 86.6 /100 | #137 | Excellent $40,596 |
| Taiwanese | 86.1 /100 | #138 | Excellent $40,576 |
| Immigrants | South Eastern Asia | 85.7 /100 | #139 | Excellent $40,558 |
| Serbians | 85.2 /100 | #140 | Excellent $40,539 |
| Immigrants | Syria | 84.1 /100 | #141 | Excellent $40,499 |
| Sri Lankans | 84.0 /100 | #142 | Excellent $40,496 |
| Northern Europeans | 83.9 /100 | #143 | Excellent $40,491 |
| Immigrants | North Macedonia | 83.8 /100 | #144 | Excellent $40,488 |
Demographics Similar to Native Hawaiians by Median Female Earnings
In terms of median female earnings, the demographic groups most similar to Native Hawaiians are French ($38,457, a difference of 0.010%), French Canadian ($38,436, a difference of 0.060%), Immigrants from Sudan ($38,511, a difference of 0.13%), Japanese ($38,528, a difference of 0.17%), and Scottish ($38,397, a difference of 0.17%).
| Demographics | Rating | Rank | Median Female Earnings |
| Immigrants | Jamaica | 9.7 /100 | #217 | Tragic $38,625 |
| Cape Verdeans | 9.5 /100 | #218 | Tragic $38,614 |
| Nepalese | 9.3 /100 | #219 | Tragic $38,603 |
| Yugoslavians | 8.8 /100 | #220 | Tragic $38,573 |
| Immigrants | Azores | 8.8 /100 | #221 | Tragic $38,573 |
| Japanese | 8.1 /100 | #222 | Tragic $38,528 |
| Immigrants | Sudan | 7.8 /100 | #223 | Tragic $38,511 |
| Native Hawaiians | 7.1 /100 | #224 | Tragic $38,461 |
| French | 7.0 /100 | #225 | Tragic $38,457 |
| French Canadians | 6.8 /100 | #226 | Tragic $38,436 |
| Scottish | 6.3 /100 | #227 | Tragic $38,397 |
| Sub-Saharan Africans | 6.2 /100 | #228 | Tragic $38,391 |
| Belgians | 6.1 /100 | #229 | Tragic $38,382 |
| Basques | 5.7 /100 | #230 | Tragic $38,352 |
| Somalis | 5.5 /100 | #231 | Tragic $38,333 |