Native/Alaskan vs Canadian Median Female Earnings
COMPARE
Native/Alaskan
Canadian
Median Female Earnings
Median Female Earnings Comparison
Natives/Alaskans
Canadians
$33,806
MEDIAN FEMALE EARNINGS
0.0/ 100
METRIC RATING
331st/ 347
METRIC RANK
$39,724
MEDIAN FEMALE EARNINGS
51.4/ 100
METRIC RATING
173rd/ 347
METRIC RANK
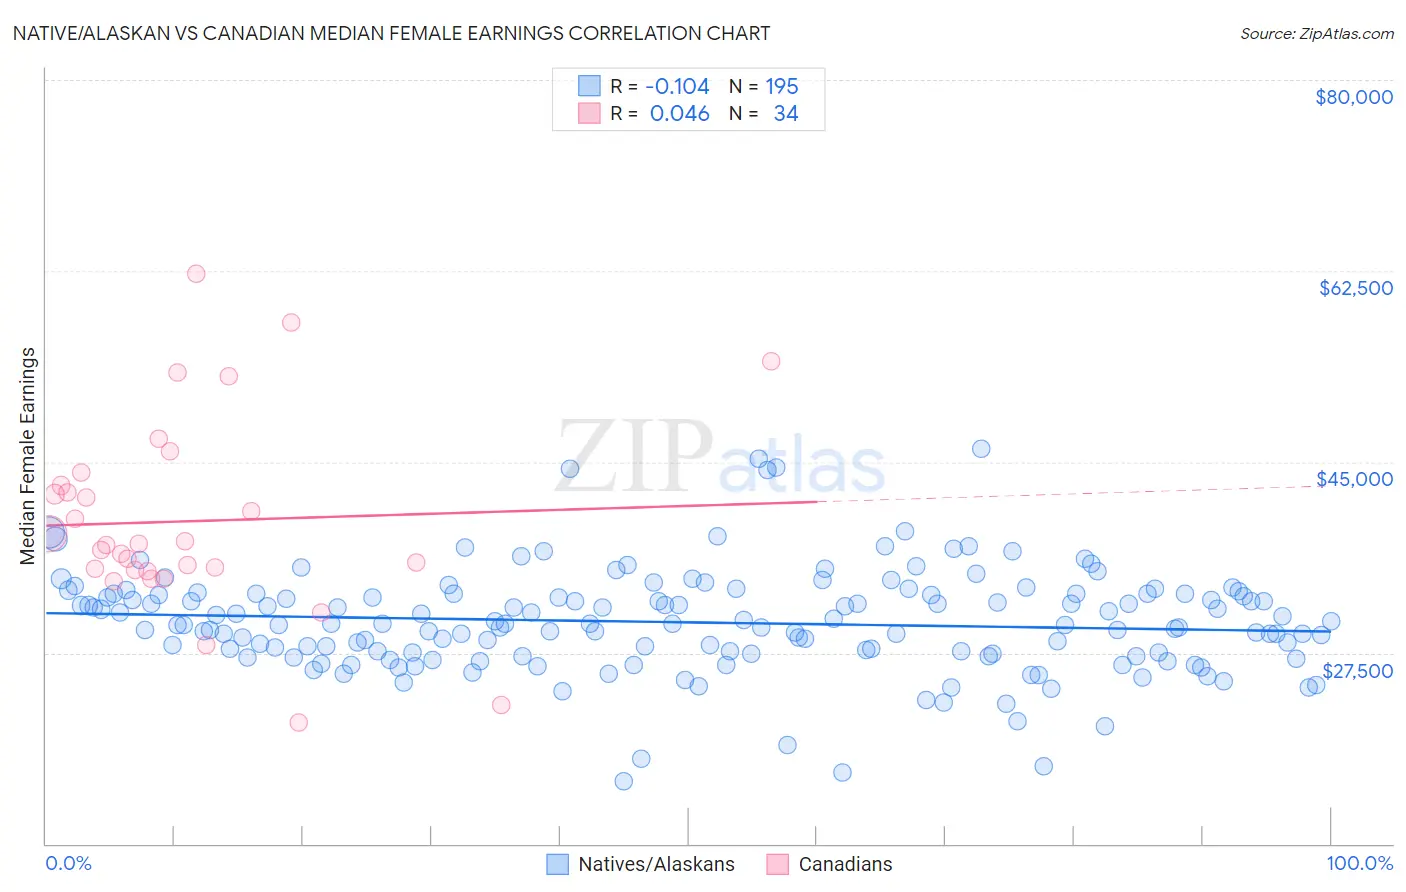
Native/Alaskan vs Canadian Median Female Earnings Correlation Chart
The statistical analysis conducted on geographies consisting of 512,112,793 people shows a poor negative correlation between the proportion of Natives/Alaskans and median female earnings in the United States with a correlation coefficient (R) of -0.104 and weighted average of $33,806. Similarly, the statistical analysis conducted on geographies consisting of 437,261,658 people shows no correlation between the proportion of Canadians and median female earnings in the United States with a correlation coefficient (R) of 0.046 and weighted average of $39,724, a difference of 17.5%.
Median Female Earnings Correlation Summary
| Measurement | Native/Alaskan | Canadian |
| Minimum | $15,696 | $21,111 |
| Maximum | $46,195 | $62,276 |
| Range | $30,499 | $41,165 |
| Mean | $30,297 | $39,561 |
| Median | $30,121 | $37,391 |
| Interquartile 25% (IQ1) | $27,399 | $35,143 |
| Interquartile 75% (IQ3) | $32,868 | $42,841 |
| Interquartile Range (IQR) | $5,469 | $7,698 |
| Standard Deviation (Sample) | $4,739 | $8,927 |
| Standard Deviation (Population) | $4,727 | $8,795 |
Similar Demographics by Median Female Earnings
Demographics Similar to Natives/Alaskans by Median Female Earnings
In terms of median female earnings, the demographic groups most similar to Natives/Alaskans are Choctaw ($33,775, a difference of 0.090%), Menominee ($33,894, a difference of 0.26%), Hopi ($33,932, a difference of 0.37%), Mexican ($33,664, a difference of 0.42%), and Immigrants from Central America ($33,953, a difference of 0.43%).
| Demographics | Rating | Rank | Median Female Earnings |
| Immigrants | Congo | 0.0 /100 | #324 | Tragic $34,317 |
| Dutch West Indians | 0.0 /100 | #325 | Tragic $34,106 |
| Kiowa | 0.0 /100 | #326 | Tragic $34,074 |
| Cajuns | 0.0 /100 | #327 | Tragic $34,034 |
| Immigrants | Central America | 0.0 /100 | #328 | Tragic $33,953 |
| Hopi | 0.0 /100 | #329 | Tragic $33,932 |
| Menominee | 0.0 /100 | #330 | Tragic $33,894 |
| Natives/Alaskans | 0.0 /100 | #331 | Tragic $33,806 |
| Choctaw | 0.0 /100 | #332 | Tragic $33,775 |
| Mexicans | 0.0 /100 | #333 | Tragic $33,664 |
| Spanish American Indians | 0.0 /100 | #334 | Tragic $33,625 |
| Creek | 0.0 /100 | #335 | Tragic $33,437 |
| Ottawa | 0.0 /100 | #336 | Tragic $33,378 |
| Yakama | 0.0 /100 | #337 | Tragic $33,354 |
| Immigrants | Cuba | 0.0 /100 | #338 | Tragic $33,291 |
Demographics Similar to Canadians by Median Female Earnings
In terms of median female earnings, the demographic groups most similar to Canadians are South American ($39,698, a difference of 0.070%), British ($39,772, a difference of 0.12%), Immigrants from Portugal ($39,788, a difference of 0.16%), Immigrants from South America ($39,643, a difference of 0.20%), and Nigerian ($39,641, a difference of 0.21%).
| Demographics | Rating | Rank | Median Female Earnings |
| Immigrants | Ghana | 60.0 /100 | #166 | Good $39,894 |
| Luxembourgers | 59.9 /100 | #167 | Average $39,891 |
| Immigrants | Peru | 58.9 /100 | #168 | Average $39,871 |
| Kenyans | 58.4 /100 | #169 | Average $39,860 |
| Slovenes | 56.2 /100 | #170 | Average $39,817 |
| Immigrants | Portugal | 54.7 /100 | #171 | Average $39,788 |
| British | 53.8 /100 | #172 | Average $39,772 |
| Canadians | 51.4 /100 | #173 | Average $39,724 |
| South Americans | 50.0 /100 | #174 | Average $39,698 |
| Immigrants | South America | 47.2 /100 | #175 | Average $39,643 |
| Nigerians | 47.0 /100 | #176 | Average $39,641 |
| Costa Ricans | 46.1 /100 | #177 | Average $39,622 |
| Slavs | 45.6 /100 | #178 | Average $39,613 |
| Immigrants | Germany | 45.1 /100 | #179 | Average $39,603 |
| Immigrants | Kenya | 41.6 /100 | #180 | Average $39,535 |