Paiute vs Immigrants from Sudan Median Earnings
COMPARE
Paiute
Immigrants from Sudan
Median Earnings
Median Earnings Comparison
Paiute
Immigrants from Sudan
$41,508
MEDIAN EARNINGS
0.1/ 100
METRIC RATING
290th/ 347
METRIC RANK
$44,767
MEDIAN EARNINGS
8.8/ 100
METRIC RATING
233rd/ 347
METRIC RANK
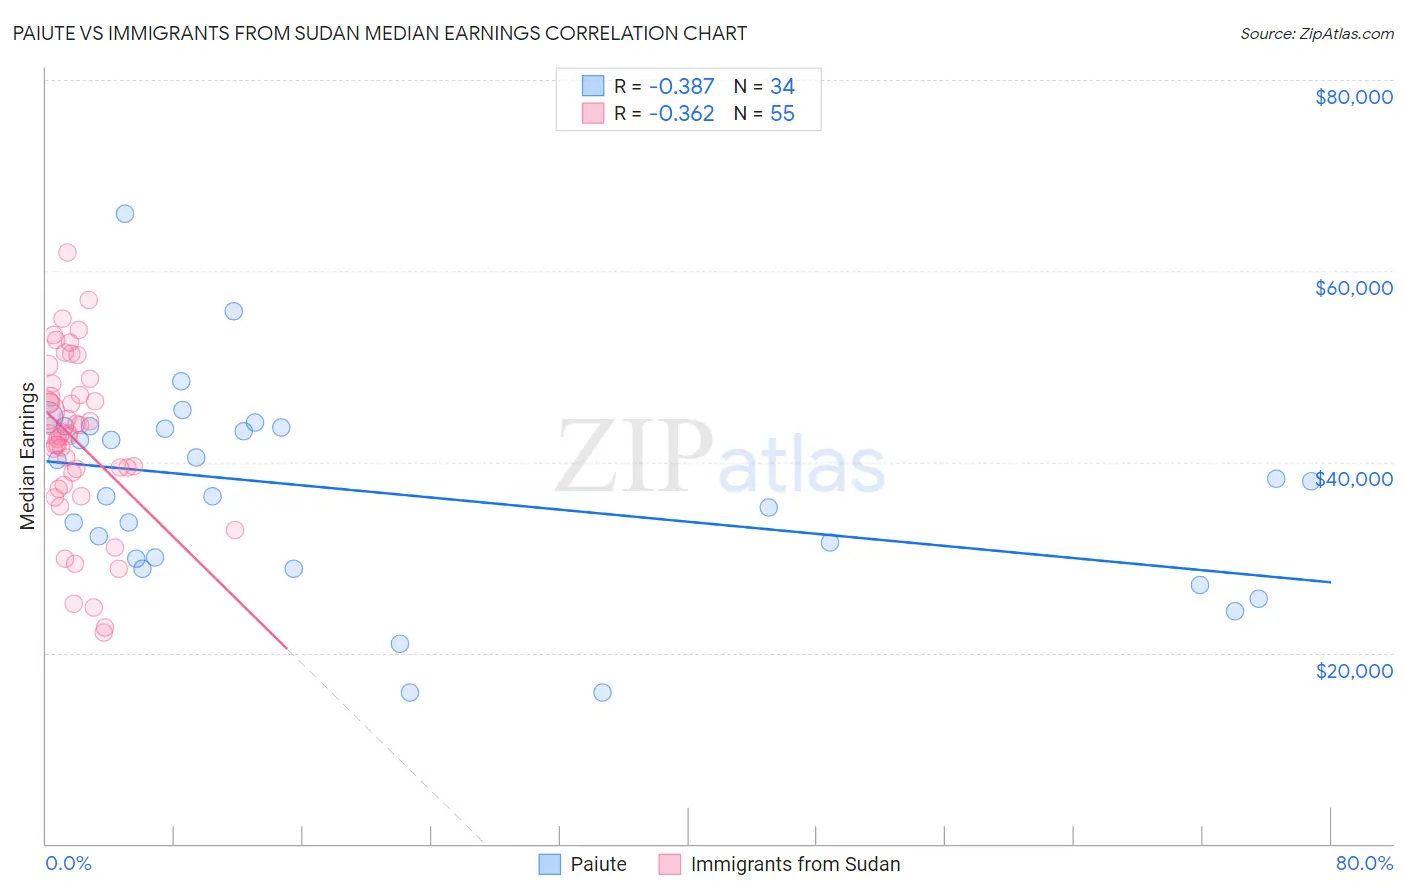
Paiute vs Immigrants from Sudan Median Earnings Correlation Chart
The statistical analysis conducted on geographies consisting of 58,401,249 people shows a mild negative correlation between the proportion of Paiute and median earnings in the United States with a correlation coefficient (R) of -0.387 and weighted average of $41,508. Similarly, the statistical analysis conducted on geographies consisting of 118,956,438 people shows a mild negative correlation between the proportion of Immigrants from Sudan and median earnings in the United States with a correlation coefficient (R) of -0.362 and weighted average of $44,767, a difference of 7.9%.
Median Earnings Correlation Summary
| Measurement | Paiute | Immigrants from Sudan |
| Minimum | $15,859 | $22,094 |
| Maximum | $65,957 | $61,886 |
| Range | $50,098 | $39,792 |
| Mean | $36,753 | $42,201 |
| Median | $37,218 | $42,956 |
| Interquartile 25% (IQ1) | $29,813 | $37,545 |
| Interquartile 75% (IQ3) | $43,606 | $47,029 |
| Interquartile Range (IQR) | $13,793 | $9,484 |
| Standard Deviation (Sample) | $10,514 | $8,696 |
| Standard Deviation (Population) | $10,358 | $8,617 |
Similar Demographics by Median Earnings
Demographics Similar to Paiute by Median Earnings
In terms of median earnings, the demographic groups most similar to Paiute are Comanche ($41,519, a difference of 0.030%), Central American Indian ($41,474, a difference of 0.080%), Immigrants from Dominican Republic ($41,554, a difference of 0.11%), U.S. Virgin Islander ($41,448, a difference of 0.15%), and Immigrants from Zaire ($41,325, a difference of 0.44%).
| Demographics | Rating | Rank | Median Earnings |
| Dominicans | 0.2 /100 | #283 | Tragic $41,864 |
| Blackfeet | 0.2 /100 | #284 | Tragic $41,822 |
| Immigrants | Nicaragua | 0.1 /100 | #285 | Tragic $41,737 |
| Mexican American Indians | 0.1 /100 | #286 | Tragic $41,719 |
| Indonesians | 0.1 /100 | #287 | Tragic $41,701 |
| Immigrants | Dominican Republic | 0.1 /100 | #288 | Tragic $41,554 |
| Comanche | 0.1 /100 | #289 | Tragic $41,519 |
| Paiute | 0.1 /100 | #290 | Tragic $41,508 |
| Central American Indians | 0.1 /100 | #291 | Tragic $41,474 |
| U.S. Virgin Islanders | 0.1 /100 | #292 | Tragic $41,448 |
| Immigrants | Zaire | 0.1 /100 | #293 | Tragic $41,325 |
| Potawatomi | 0.1 /100 | #294 | Tragic $41,288 |
| Bangladeshis | 0.1 /100 | #295 | Tragic $41,263 |
| Cherokee | 0.1 /100 | #296 | Tragic $41,252 |
| Guatemalans | 0.1 /100 | #297 | Tragic $41,205 |
Demographics Similar to Immigrants from Sudan by Median Earnings
In terms of median earnings, the demographic groups most similar to Immigrants from Sudan are Delaware ($44,783, a difference of 0.040%), Japanese ($44,825, a difference of 0.13%), Immigrants from Western Africa ($44,893, a difference of 0.28%), Cape Verdean ($44,640, a difference of 0.28%), and Scotch-Irish ($44,924, a difference of 0.35%).
| Demographics | Rating | Rank | Median Earnings |
| Immigrants | Nigeria | 12.2 /100 | #226 | Poor $45,030 |
| Native Hawaiians | 12.2 /100 | #227 | Poor $45,027 |
| Immigrants | Iraq | 11.6 /100 | #228 | Poor $44,988 |
| Scotch-Irish | 10.7 /100 | #229 | Poor $44,924 |
| Immigrants | Western Africa | 10.3 /100 | #230 | Poor $44,893 |
| Japanese | 9.5 /100 | #231 | Tragic $44,825 |
| Delaware | 9.0 /100 | #232 | Tragic $44,783 |
| Immigrants | Sudan | 8.8 /100 | #233 | Tragic $44,767 |
| Cape Verdeans | 7.5 /100 | #234 | Tragic $44,640 |
| Venezuelans | 6.9 /100 | #235 | Tragic $44,580 |
| British West Indians | 6.7 /100 | #236 | Tragic $44,552 |
| Immigrants | Ecuador | 5.9 /100 | #237 | Tragic $44,462 |
| Sudanese | 5.6 /100 | #238 | Tragic $44,419 |
| Senegalese | 5.3 /100 | #239 | Tragic $44,373 |
| Aleuts | 4.4 /100 | #240 | Tragic $44,241 |