Norwegian vs Immigrants from Sudan Median Earnings
COMPARE
Norwegian
Immigrants from Sudan
Median Earnings
Median Earnings Comparison
Norwegians
Immigrants from Sudan
$46,865
MEDIAN EARNINGS
64.7/ 100
METRIC RATING
164th/ 347
METRIC RANK
$44,767
MEDIAN EARNINGS
8.8/ 100
METRIC RATING
233rd/ 347
METRIC RANK
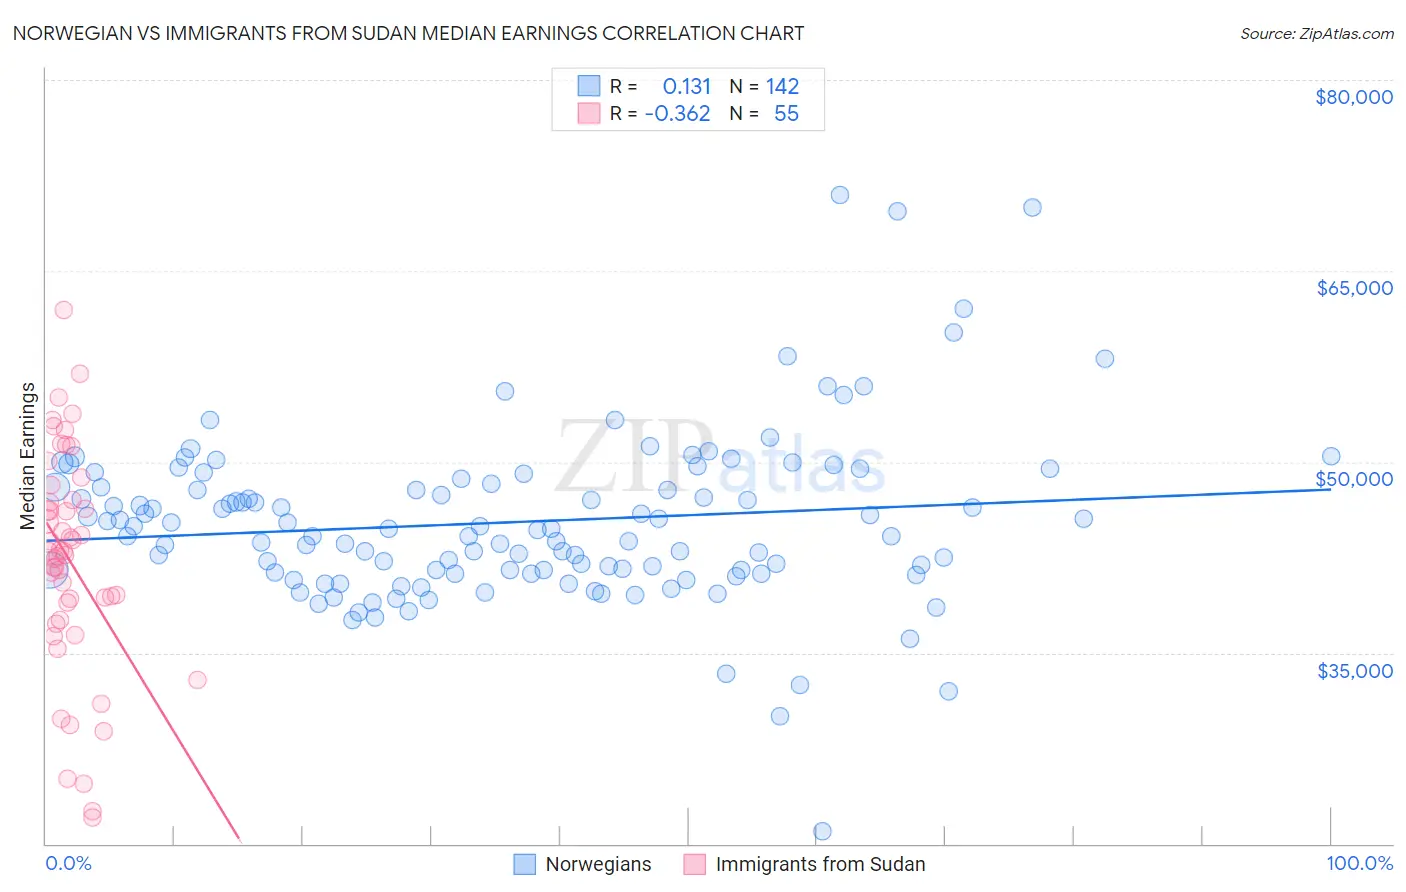
Norwegian vs Immigrants from Sudan Median Earnings Correlation Chart
The statistical analysis conducted on geographies consisting of 533,161,956 people shows a poor positive correlation between the proportion of Norwegians and median earnings in the United States with a correlation coefficient (R) of 0.131 and weighted average of $46,865. Similarly, the statistical analysis conducted on geographies consisting of 118,956,438 people shows a mild negative correlation between the proportion of Immigrants from Sudan and median earnings in the United States with a correlation coefficient (R) of -0.362 and weighted average of $44,767, a difference of 4.7%.
Median Earnings Correlation Summary
| Measurement | Norwegian | Immigrants from Sudan |
| Minimum | $21,029 | $22,094 |
| Maximum | $70,965 | $61,886 |
| Range | $49,936 | $39,792 |
| Mean | $45,261 | $42,201 |
| Median | $44,720 | $42,956 |
| Interquartile 25% (IQ1) | $41,272 | $37,545 |
| Interquartile 75% (IQ3) | $48,283 | $47,029 |
| Interquartile Range (IQR) | $7,011 | $9,484 |
| Standard Deviation (Sample) | $6,752 | $8,696 |
| Standard Deviation (Population) | $6,728 | $8,617 |
Similar Demographics by Median Earnings
Demographics Similar to Norwegians by Median Earnings
In terms of median earnings, the demographic groups most similar to Norwegians are Icelander ($46,916, a difference of 0.11%), South American ($46,804, a difference of 0.13%), South American Indian ($46,952, a difference of 0.18%), Immigrants from Eastern Africa ($46,969, a difference of 0.22%), and Immigrants from Peru ($47,025, a difference of 0.34%).
| Demographics | Rating | Rank | Median Earnings |
| Czechs | 75.1 /100 | #157 | Good $47,221 |
| Slovaks | 71.7 /100 | #158 | Good $47,095 |
| Immigrants | Peru | 69.6 /100 | #159 | Good $47,025 |
| Alsatians | 69.6 /100 | #160 | Good $47,023 |
| Immigrants | Eastern Africa | 68.0 /100 | #161 | Good $46,969 |
| South American Indians | 67.4 /100 | #162 | Good $46,952 |
| Icelanders | 66.3 /100 | #163 | Good $46,916 |
| Norwegians | 64.7 /100 | #164 | Good $46,865 |
| South Americans | 62.7 /100 | #165 | Good $46,804 |
| Czechoslovakians | 57.8 /100 | #166 | Average $46,658 |
| Costa Ricans | 57.4 /100 | #167 | Average $46,645 |
| Immigrants | Africa | 54.6 /100 | #168 | Average $46,564 |
| Immigrants | South America | 54.0 /100 | #169 | Average $46,548 |
| Immigrants | Immigrants | 51.6 /100 | #170 | Average $46,478 |
| Scottish | 51.1 /100 | #171 | Average $46,463 |
Demographics Similar to Immigrants from Sudan by Median Earnings
In terms of median earnings, the demographic groups most similar to Immigrants from Sudan are Delaware ($44,783, a difference of 0.040%), Japanese ($44,825, a difference of 0.13%), Immigrants from Western Africa ($44,893, a difference of 0.28%), Cape Verdean ($44,640, a difference of 0.28%), and Scotch-Irish ($44,924, a difference of 0.35%).
| Demographics | Rating | Rank | Median Earnings |
| Immigrants | Nigeria | 12.2 /100 | #226 | Poor $45,030 |
| Native Hawaiians | 12.2 /100 | #227 | Poor $45,027 |
| Immigrants | Iraq | 11.6 /100 | #228 | Poor $44,988 |
| Scotch-Irish | 10.7 /100 | #229 | Poor $44,924 |
| Immigrants | Western Africa | 10.3 /100 | #230 | Poor $44,893 |
| Japanese | 9.5 /100 | #231 | Tragic $44,825 |
| Delaware | 9.0 /100 | #232 | Tragic $44,783 |
| Immigrants | Sudan | 8.8 /100 | #233 | Tragic $44,767 |
| Cape Verdeans | 7.5 /100 | #234 | Tragic $44,640 |
| Venezuelans | 6.9 /100 | #235 | Tragic $44,580 |
| British West Indians | 6.7 /100 | #236 | Tragic $44,552 |
| Immigrants | Ecuador | 5.9 /100 | #237 | Tragic $44,462 |
| Sudanese | 5.6 /100 | #238 | Tragic $44,419 |
| Senegalese | 5.3 /100 | #239 | Tragic $44,373 |
| Aleuts | 4.4 /100 | #240 | Tragic $44,241 |