Paiute vs Immigrants from Sudan Disability
COMPARE
Paiute
Immigrants from Sudan
Disability
Disability Comparison
Paiute
Immigrants from Sudan
13.9%
DISABILITY
0.0/ 100
METRIC RATING
321st/ 347
METRIC RANK
11.5%
DISABILITY
85.3/ 100
METRIC RATING
142nd/ 347
METRIC RANK
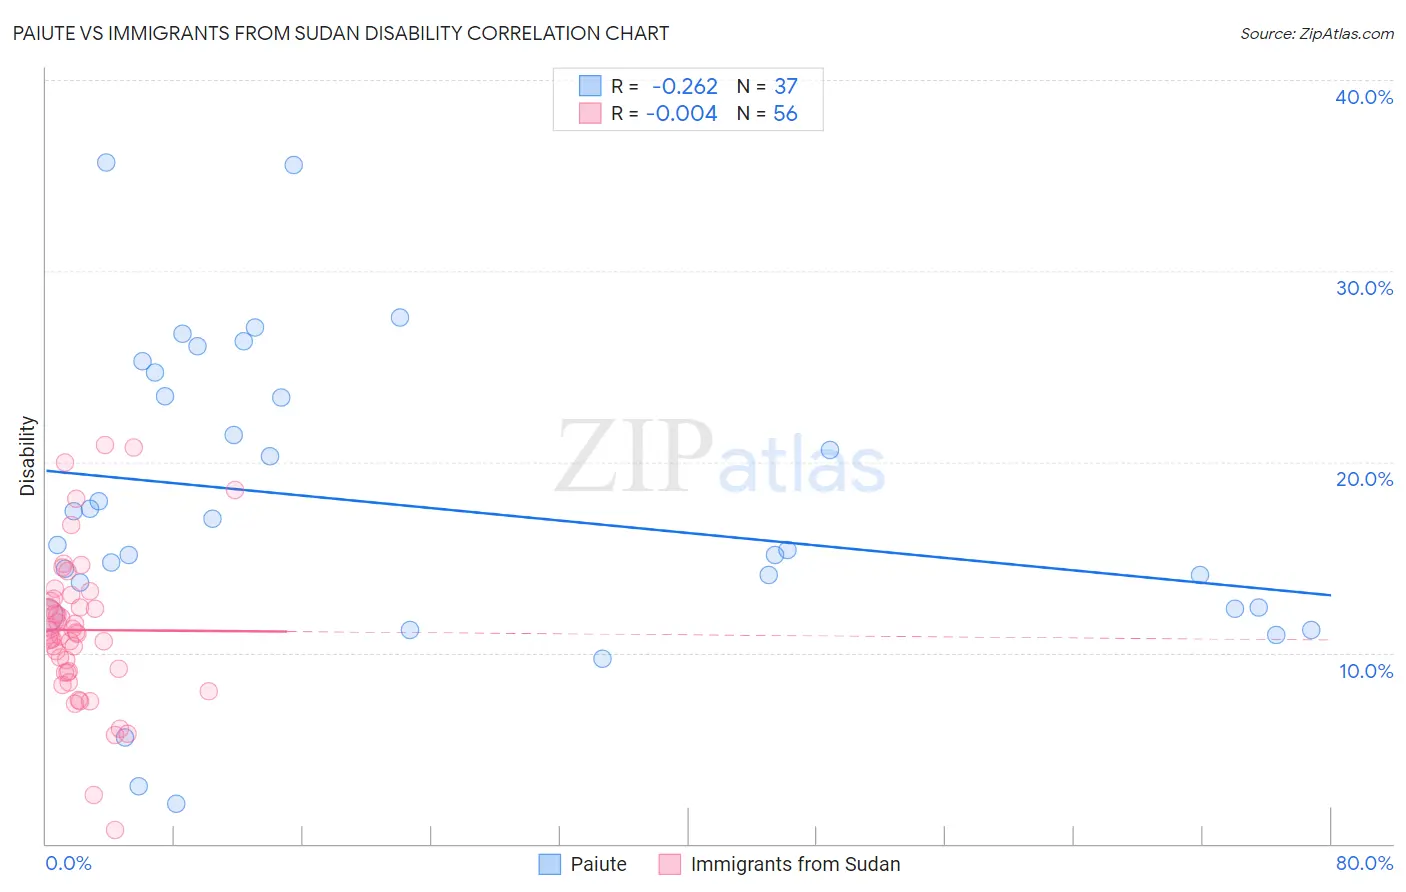
Paiute vs Immigrants from Sudan Disability Correlation Chart
The statistical analysis conducted on geographies consisting of 58,394,773 people shows a weak negative correlation between the proportion of Paiute and percentage of population with a disability in the United States with a correlation coefficient (R) of -0.262 and weighted average of 13.9%. Similarly, the statistical analysis conducted on geographies consisting of 118,962,854 people shows no correlation between the proportion of Immigrants from Sudan and percentage of population with a disability in the United States with a correlation coefficient (R) of -0.004 and weighted average of 11.5%, a difference of 20.9%.
Disability Correlation Summary
| Measurement | Paiute | Immigrants from Sudan |
| Minimum | 2.1% | 0.75% |
| Maximum | 35.7% | 20.9% |
| Range | 33.6% | 20.1% |
| Mean | 17.7% | 11.2% |
| Median | 15.7% | 11.0% |
| Interquartile 25% (IQ1) | 12.3% | 9.0% |
| Interquartile 75% (IQ3) | 24.0% | 12.8% |
| Interquartile Range (IQR) | 11.7% | 3.8% |
| Standard Deviation (Sample) | 7.9% | 3.9% |
| Standard Deviation (Population) | 7.8% | 3.9% |
Similar Demographics by Disability
Demographics Similar to Paiute by Disability
In terms of disability, the demographic groups most similar to Paiute are Apache (13.9%, a difference of 0.13%), Iroquois (13.8%, a difference of 0.42%), American (13.9%, a difference of 0.42%), Menominee (13.8%, a difference of 0.63%), and Pima (13.7%, a difference of 1.2%).
| Demographics | Rating | Rank | Disability |
| Blacks/African Americans | 0.0 /100 | #314 | Tragic 13.7% |
| Puget Sound Salish | 0.0 /100 | #315 | Tragic 13.7% |
| Pima | 0.0 /100 | #316 | Tragic 13.7% |
| Immigrants | Cabo Verde | 0.0 /100 | #317 | Tragic 13.7% |
| Menominee | 0.0 /100 | #318 | Tragic 13.8% |
| Iroquois | 0.0 /100 | #319 | Tragic 13.8% |
| Apache | 0.0 /100 | #320 | Tragic 13.9% |
| Paiute | 0.0 /100 | #321 | Tragic 13.9% |
| Americans | 0.0 /100 | #322 | Tragic 13.9% |
| Comanche | 0.0 /100 | #323 | Tragic 14.1% |
| Chippewa | 0.0 /100 | #324 | Tragic 14.1% |
| Natives/Alaskans | 0.0 /100 | #325 | Tragic 14.2% |
| Osage | 0.0 /100 | #326 | Tragic 14.2% |
| Ottawa | 0.0 /100 | #327 | Tragic 14.2% |
| Immigrants | Azores | 0.0 /100 | #328 | Tragic 14.2% |
Demographics Similar to Immigrants from Sudan by Disability
In terms of disability, the demographic groups most similar to Immigrants from Sudan are Immigrants from Grenada (11.5%, a difference of 0.070%), Russian (11.5%, a difference of 0.14%), New Zealander (11.5%, a difference of 0.16%), Ghanaian (11.5%, a difference of 0.16%), and Kenyan (11.5%, a difference of 0.17%).
| Demographics | Rating | Rank | Disability |
| Ugandans | 87.9 /100 | #135 | Excellent 11.4% |
| Immigrants | St. Vincent and the Grenadines | 87.8 /100 | #136 | Excellent 11.4% |
| Kenyans | 87.1 /100 | #137 | Excellent 11.5% |
| New Zealanders | 87.0 /100 | #138 | Excellent 11.5% |
| Ghanaians | 87.0 /100 | #139 | Excellent 11.5% |
| Russians | 86.8 /100 | #140 | Excellent 11.5% |
| Immigrants | Grenada | 86.1 /100 | #141 | Excellent 11.5% |
| Immigrants | Sudan | 85.3 /100 | #142 | Excellent 11.5% |
| Moroccans | 83.3 /100 | #143 | Excellent 11.5% |
| Australians | 82.5 /100 | #144 | Excellent 11.5% |
| Nigerians | 81.3 /100 | #145 | Excellent 11.5% |
| Immigrants | Hungary | 79.0 /100 | #146 | Good 11.5% |
| Immigrants | Ukraine | 77.6 /100 | #147 | Good 11.5% |
| Sudanese | 77.1 /100 | #148 | Good 11.5% |
| Immigrants | Norway | 73.2 /100 | #149 | Good 11.6% |