Immigrants from North America vs Immigrants from Sudan Median Earnings
COMPARE
Immigrants from North America
Immigrants from Sudan
Median Earnings
Median Earnings Comparison
Immigrants from North America
Immigrants from Sudan
$50,108
MEDIAN EARNINGS
99.4/ 100
METRIC RATING
89th/ 347
METRIC RANK
$44,767
MEDIAN EARNINGS
8.8/ 100
METRIC RATING
233rd/ 347
METRIC RANK
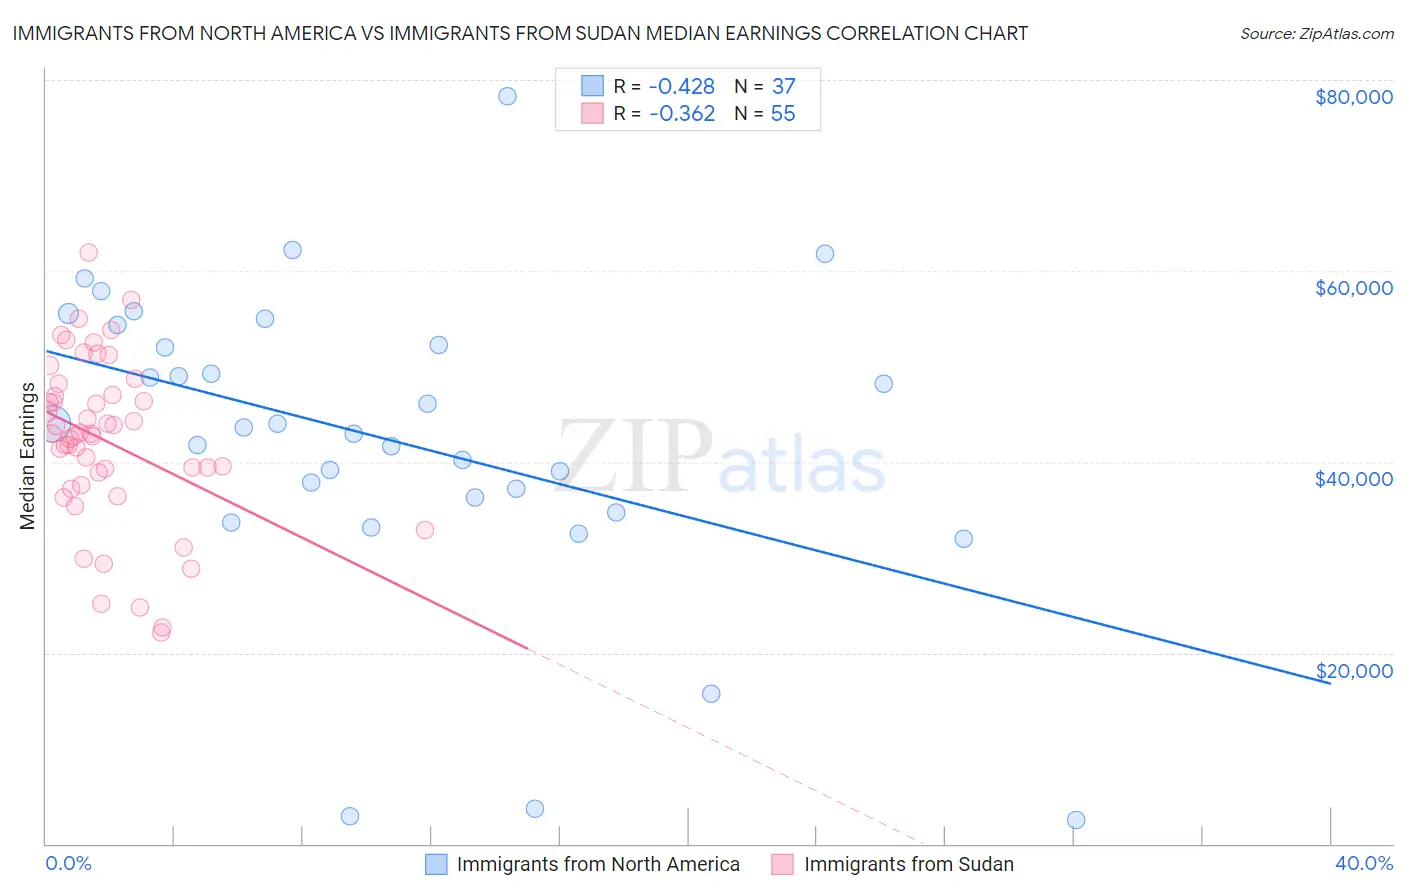
Immigrants from North America vs Immigrants from Sudan Median Earnings Correlation Chart
The statistical analysis conducted on geographies consisting of 462,391,423 people shows a moderate negative correlation between the proportion of Immigrants from North America and median earnings in the United States with a correlation coefficient (R) of -0.428 and weighted average of $50,108. Similarly, the statistical analysis conducted on geographies consisting of 118,956,438 people shows a mild negative correlation between the proportion of Immigrants from Sudan and median earnings in the United States with a correlation coefficient (R) of -0.362 and weighted average of $44,767, a difference of 11.9%.
Median Earnings Correlation Summary
| Measurement | Immigrants from North America | Immigrants from Sudan |
| Minimum | $2,499 | $22,094 |
| Maximum | $78,310 | $61,886 |
| Range | $75,811 | $39,792 |
| Mean | $42,268 | $42,201 |
| Median | $43,536 | $42,956 |
| Interquartile 25% (IQ1) | $35,442 | $37,545 |
| Interquartile 75% (IQ3) | $53,269 | $47,029 |
| Interquartile Range (IQR) | $17,827 | $9,484 |
| Standard Deviation (Sample) | $16,254 | $8,696 |
| Standard Deviation (Population) | $16,033 | $8,617 |
Similar Demographics by Median Earnings
Demographics Similar to Immigrants from North America by Median Earnings
In terms of median earnings, the demographic groups most similar to Immigrants from North America are Albanian ($50,116, a difference of 0.020%), Immigrants from Uzbekistan ($50,151, a difference of 0.090%), Immigrants from Canada ($50,192, a difference of 0.17%), Immigrants from Kazakhstan ($50,225, a difference of 0.23%), and Immigrants from Hungary ($50,227, a difference of 0.24%).
| Demographics | Rating | Rank | Median Earnings |
| Immigrants | Moldova | 99.5 /100 | #82 | Exceptional $50,274 |
| Romanians | 99.5 /100 | #83 | Exceptional $50,244 |
| Immigrants | Hungary | 99.5 /100 | #84 | Exceptional $50,227 |
| Immigrants | Kazakhstan | 99.5 /100 | #85 | Exceptional $50,225 |
| Immigrants | Canada | 99.5 /100 | #86 | Exceptional $50,192 |
| Immigrants | Uzbekistan | 99.5 /100 | #87 | Exceptional $50,151 |
| Albanians | 99.4 /100 | #88 | Exceptional $50,116 |
| Immigrants | North America | 99.4 /100 | #89 | Exceptional $50,108 |
| Italians | 99.3 /100 | #90 | Exceptional $49,915 |
| Macedonians | 99.2 /100 | #91 | Exceptional $49,893 |
| Immigrants | Argentina | 99.2 /100 | #92 | Exceptional $49,841 |
| Armenians | 99.1 /100 | #93 | Exceptional $49,804 |
| Croatians | 99.0 /100 | #94 | Exceptional $49,724 |
| Immigrants | England | 99.0 /100 | #95 | Exceptional $49,722 |
| Immigrants | Lebanon | 99.0 /100 | #96 | Exceptional $49,682 |
Demographics Similar to Immigrants from Sudan by Median Earnings
In terms of median earnings, the demographic groups most similar to Immigrants from Sudan are Delaware ($44,783, a difference of 0.040%), Japanese ($44,825, a difference of 0.13%), Immigrants from Western Africa ($44,893, a difference of 0.28%), Cape Verdean ($44,640, a difference of 0.28%), and Scotch-Irish ($44,924, a difference of 0.35%).
| Demographics | Rating | Rank | Median Earnings |
| Immigrants | Nigeria | 12.2 /100 | #226 | Poor $45,030 |
| Native Hawaiians | 12.2 /100 | #227 | Poor $45,027 |
| Immigrants | Iraq | 11.6 /100 | #228 | Poor $44,988 |
| Scotch-Irish | 10.7 /100 | #229 | Poor $44,924 |
| Immigrants | Western Africa | 10.3 /100 | #230 | Poor $44,893 |
| Japanese | 9.5 /100 | #231 | Tragic $44,825 |
| Delaware | 9.0 /100 | #232 | Tragic $44,783 |
| Immigrants | Sudan | 8.8 /100 | #233 | Tragic $44,767 |
| Cape Verdeans | 7.5 /100 | #234 | Tragic $44,640 |
| Venezuelans | 6.9 /100 | #235 | Tragic $44,580 |
| British West Indians | 6.7 /100 | #236 | Tragic $44,552 |
| Immigrants | Ecuador | 5.9 /100 | #237 | Tragic $44,462 |
| Sudanese | 5.6 /100 | #238 | Tragic $44,419 |
| Senegalese | 5.3 /100 | #239 | Tragic $44,373 |
| Aleuts | 4.4 /100 | #240 | Tragic $44,241 |