Immigrants from Yemen vs Immigrants from Sudan Median Earnings
COMPARE
Immigrants from Yemen
Immigrants from Sudan
Median Earnings
Median Earnings Comparison
Immigrants from Yemen
Immigrants from Sudan
$39,540
MEDIAN EARNINGS
0.0/ 100
METRIC RATING
326th/ 347
METRIC RANK
$44,767
MEDIAN EARNINGS
8.8/ 100
METRIC RATING
233rd/ 347
METRIC RANK
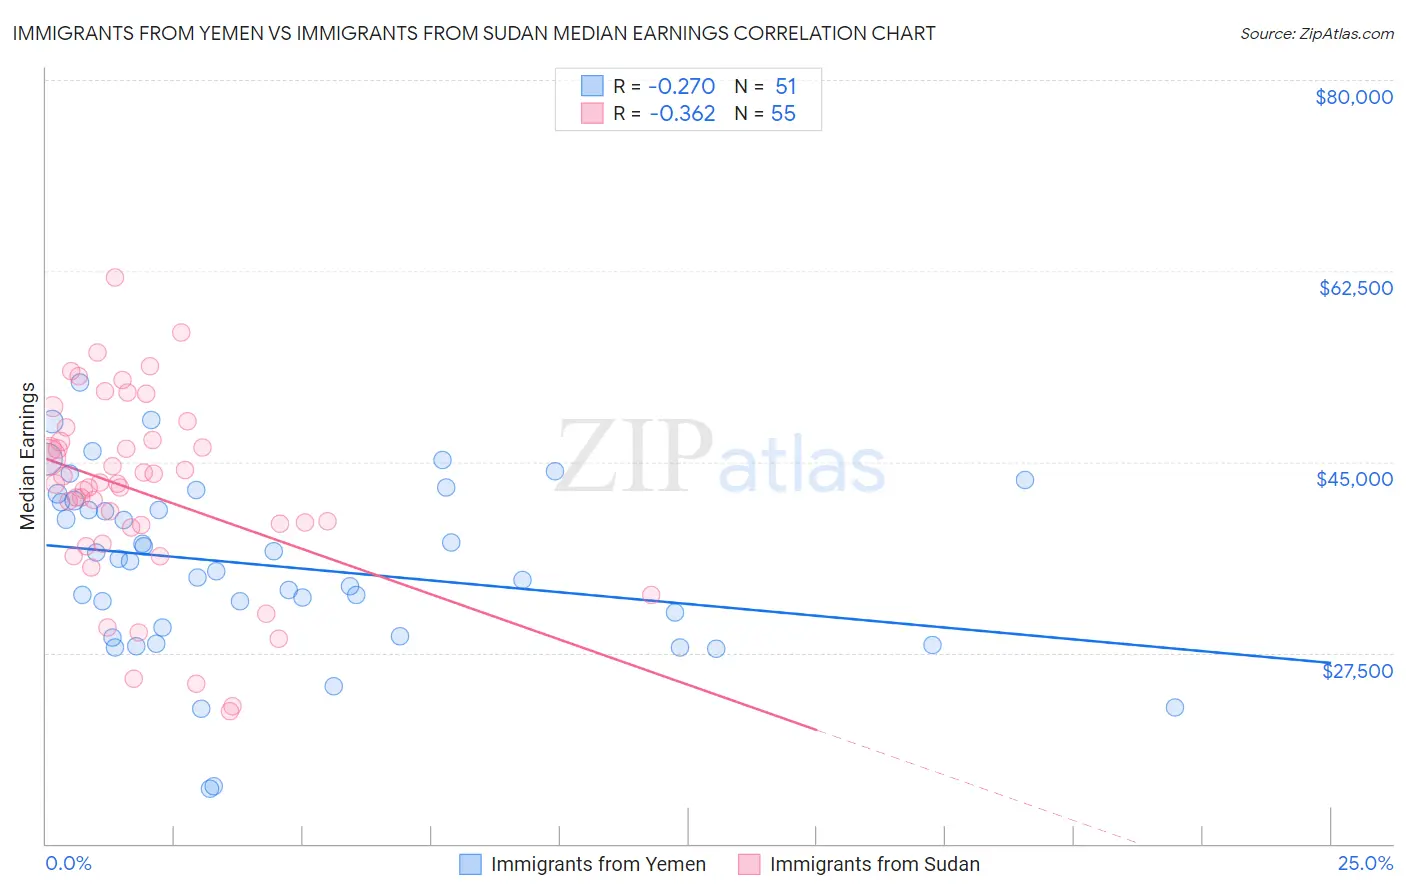
Immigrants from Yemen vs Immigrants from Sudan Median Earnings Correlation Chart
The statistical analysis conducted on geographies consisting of 82,433,611 people shows a weak negative correlation between the proportion of Immigrants from Yemen and median earnings in the United States with a correlation coefficient (R) of -0.270 and weighted average of $39,540. Similarly, the statistical analysis conducted on geographies consisting of 118,956,438 people shows a mild negative correlation between the proportion of Immigrants from Sudan and median earnings in the United States with a correlation coefficient (R) of -0.362 and weighted average of $44,767, a difference of 13.2%.
Median Earnings Correlation Summary
| Measurement | Immigrants from Yemen | Immigrants from Sudan |
| Minimum | $15,000 | $22,094 |
| Maximum | $52,299 | $61,886 |
| Range | $37,299 | $39,792 |
| Mean | $35,429 | $42,201 |
| Median | $35,934 | $42,956 |
| Interquartile 25% (IQ1) | $29,005 | $37,545 |
| Interquartile 75% (IQ3) | $41,449 | $47,029 |
| Interquartile Range (IQR) | $12,444 | $9,484 |
| Standard Deviation (Sample) | $8,118 | $8,696 |
| Standard Deviation (Population) | $8,038 | $8,617 |
Similar Demographics by Median Earnings
Demographics Similar to Immigrants from Yemen by Median Earnings
In terms of median earnings, the demographic groups most similar to Immigrants from Yemen are Yuman ($39,523, a difference of 0.040%), Sioux ($39,448, a difference of 0.23%), Creek ($39,648, a difference of 0.27%), Ottawa ($39,721, a difference of 0.46%), and Bahamian ($39,735, a difference of 0.49%).
| Demographics | Rating | Rank | Median Earnings |
| Blacks/African Americans | 0.0 /100 | #319 | Tragic $40,085 |
| Immigrants | Bahamas | 0.0 /100 | #320 | Tragic $39,861 |
| Mexicans | 0.0 /100 | #321 | Tragic $39,834 |
| Immigrants | Central America | 0.0 /100 | #322 | Tragic $39,762 |
| Bahamians | 0.0 /100 | #323 | Tragic $39,735 |
| Ottawa | 0.0 /100 | #324 | Tragic $39,721 |
| Creek | 0.0 /100 | #325 | Tragic $39,648 |
| Immigrants | Yemen | 0.0 /100 | #326 | Tragic $39,540 |
| Yuman | 0.0 /100 | #327 | Tragic $39,523 |
| Sioux | 0.0 /100 | #328 | Tragic $39,448 |
| Kiowa | 0.0 /100 | #329 | Tragic $39,232 |
| Immigrants | Congo | 0.0 /100 | #330 | Tragic $39,169 |
| Immigrants | Mexico | 0.0 /100 | #331 | Tragic $39,114 |
| Yakama | 0.0 /100 | #332 | Tragic $39,107 |
| Houma | 0.0 /100 | #333 | Tragic $38,949 |
Demographics Similar to Immigrants from Sudan by Median Earnings
In terms of median earnings, the demographic groups most similar to Immigrants from Sudan are Delaware ($44,783, a difference of 0.040%), Japanese ($44,825, a difference of 0.13%), Immigrants from Western Africa ($44,893, a difference of 0.28%), Cape Verdean ($44,640, a difference of 0.28%), and Scotch-Irish ($44,924, a difference of 0.35%).
| Demographics | Rating | Rank | Median Earnings |
| Immigrants | Nigeria | 12.2 /100 | #226 | Poor $45,030 |
| Native Hawaiians | 12.2 /100 | #227 | Poor $45,027 |
| Immigrants | Iraq | 11.6 /100 | #228 | Poor $44,988 |
| Scotch-Irish | 10.7 /100 | #229 | Poor $44,924 |
| Immigrants | Western Africa | 10.3 /100 | #230 | Poor $44,893 |
| Japanese | 9.5 /100 | #231 | Tragic $44,825 |
| Delaware | 9.0 /100 | #232 | Tragic $44,783 |
| Immigrants | Sudan | 8.8 /100 | #233 | Tragic $44,767 |
| Cape Verdeans | 7.5 /100 | #234 | Tragic $44,640 |
| Venezuelans | 6.9 /100 | #235 | Tragic $44,580 |
| British West Indians | 6.7 /100 | #236 | Tragic $44,552 |
| Immigrants | Ecuador | 5.9 /100 | #237 | Tragic $44,462 |
| Sudanese | 5.6 /100 | #238 | Tragic $44,419 |
| Senegalese | 5.3 /100 | #239 | Tragic $44,373 |
| Aleuts | 4.4 /100 | #240 | Tragic $44,241 |