Paiute vs Colville Median Earnings
COMPARE
Paiute
Colville
Median Earnings
Median Earnings Comparison
Paiute
Colville
$41,508
MEDIAN EARNINGS
0.1/ 100
METRIC RATING
290th/ 347
METRIC RANK
$42,151
MEDIAN EARNINGS
0.2/ 100
METRIC RATING
279th/ 347
METRIC RANK
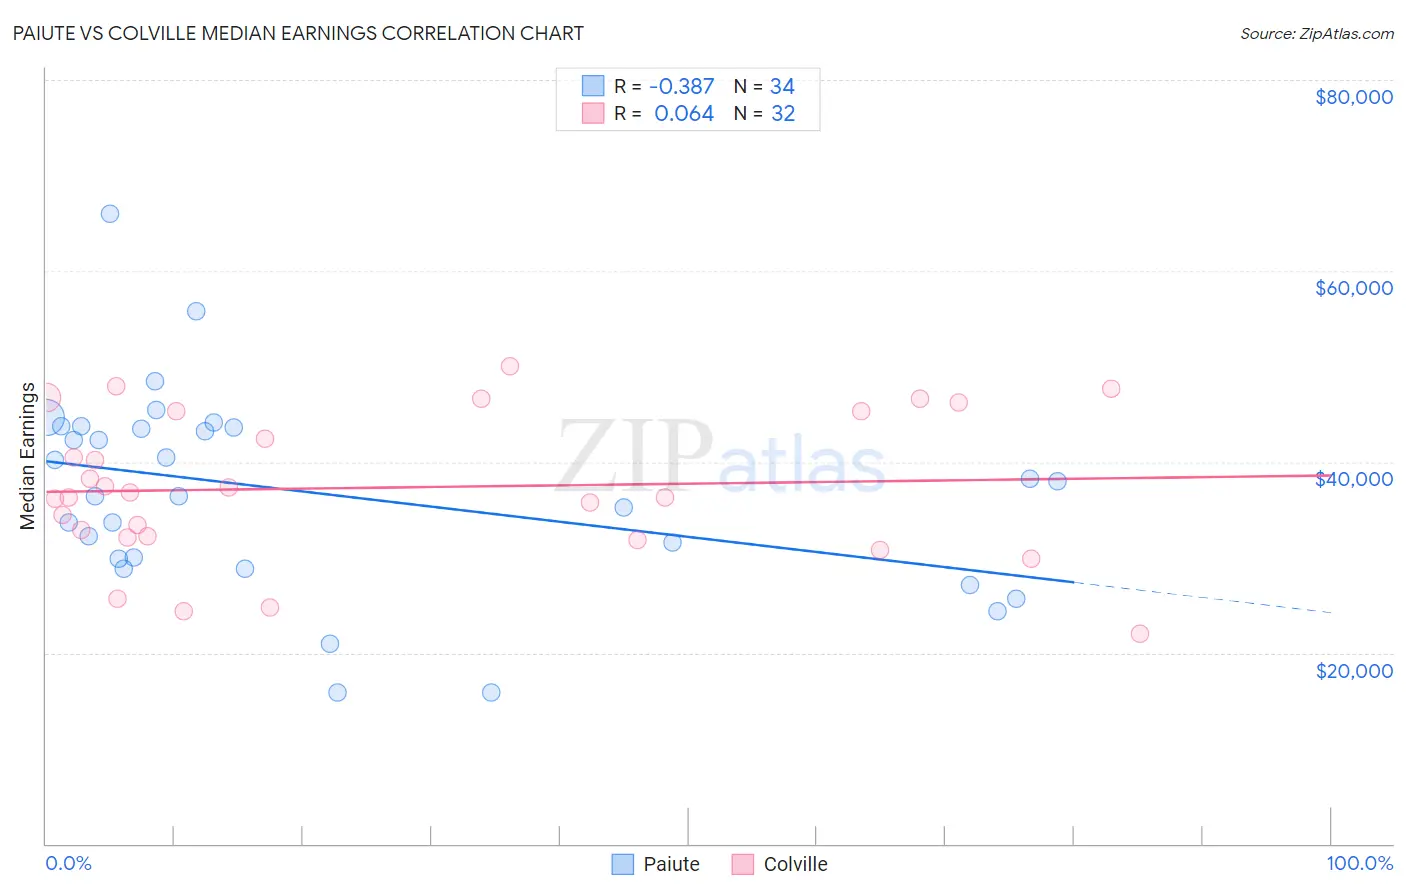
Paiute vs Colville Median Earnings Correlation Chart
The statistical analysis conducted on geographies consisting of 58,401,249 people shows a mild negative correlation between the proportion of Paiute and median earnings in the United States with a correlation coefficient (R) of -0.387 and weighted average of $41,508. Similarly, the statistical analysis conducted on geographies consisting of 34,684,676 people shows a slight positive correlation between the proportion of Colville and median earnings in the United States with a correlation coefficient (R) of 0.064 and weighted average of $42,151, a difference of 1.5%.
Median Earnings Correlation Summary
| Measurement | Paiute | Colville |
| Minimum | $15,859 | $21,944 |
| Maximum | $65,957 | $50,045 |
| Range | $50,098 | $28,101 |
| Mean | $36,753 | $37,312 |
| Median | $37,218 | $36,531 |
| Interquartile 25% (IQ1) | $29,813 | $32,193 |
| Interquartile 75% (IQ3) | $43,606 | $45,323 |
| Interquartile Range (IQR) | $13,793 | $13,130 |
| Standard Deviation (Sample) | $10,514 | $7,666 |
| Standard Deviation (Population) | $10,358 | $7,545 |
Demographics Similar to Paiute and Colville by Median Earnings
In terms of median earnings, the demographic groups most similar to Paiute are Comanche ($41,519, a difference of 0.030%), Central American Indian ($41,474, a difference of 0.080%), Immigrants from Dominican Republic ($41,554, a difference of 0.11%), U.S. Virgin Islander ($41,448, a difference of 0.15%), and Immigrants from Zaire ($41,325, a difference of 0.44%). Similarly, the demographic groups most similar to Colville are Cajun ($42,189, a difference of 0.090%), Hmong ($42,111, a difference of 0.10%), Central American ($42,280, a difference of 0.31%), Spanish American ($42,316, a difference of 0.39%), and Marshallese ($41,969, a difference of 0.43%).
| Demographics | Rating | Rank | Median Earnings |
| Immigrants | El Salvador | 0.4 /100 | #274 | Tragic $42,413 |
| Immigrants | Belize | 0.3 /100 | #275 | Tragic $42,339 |
| Spanish Americans | 0.3 /100 | #276 | Tragic $42,316 |
| Central Americans | 0.3 /100 | #277 | Tragic $42,280 |
| Cajuns | 0.3 /100 | #278 | Tragic $42,189 |
| Colville | 0.2 /100 | #279 | Tragic $42,151 |
| Hmong | 0.2 /100 | #280 | Tragic $42,111 |
| Marshallese | 0.2 /100 | #281 | Tragic $41,969 |
| Africans | 0.2 /100 | #282 | Tragic $41,955 |
| Dominicans | 0.2 /100 | #283 | Tragic $41,864 |
| Blackfeet | 0.2 /100 | #284 | Tragic $41,822 |
| Immigrants | Nicaragua | 0.1 /100 | #285 | Tragic $41,737 |
| Mexican American Indians | 0.1 /100 | #286 | Tragic $41,719 |
| Indonesians | 0.1 /100 | #287 | Tragic $41,701 |
| Immigrants | Dominican Republic | 0.1 /100 | #288 | Tragic $41,554 |
| Comanche | 0.1 /100 | #289 | Tragic $41,519 |
| Paiute | 0.1 /100 | #290 | Tragic $41,508 |
| Central American Indians | 0.1 /100 | #291 | Tragic $41,474 |
| U.S. Virgin Islanders | 0.1 /100 | #292 | Tragic $41,448 |
| Immigrants | Zaire | 0.1 /100 | #293 | Tragic $41,325 |
| Potawatomi | 0.1 /100 | #294 | Tragic $41,288 |