Sierra Leonean vs Immigrants from Sudan Median Earnings
COMPARE
Sierra Leonean
Immigrants from Sudan
Median Earnings
Median Earnings Comparison
Sierra Leoneans
Immigrants from Sudan
$48,286
MEDIAN EARNINGS
93.1/ 100
METRIC RATING
127th/ 347
METRIC RANK
$44,767
MEDIAN EARNINGS
8.8/ 100
METRIC RATING
233rd/ 347
METRIC RANK
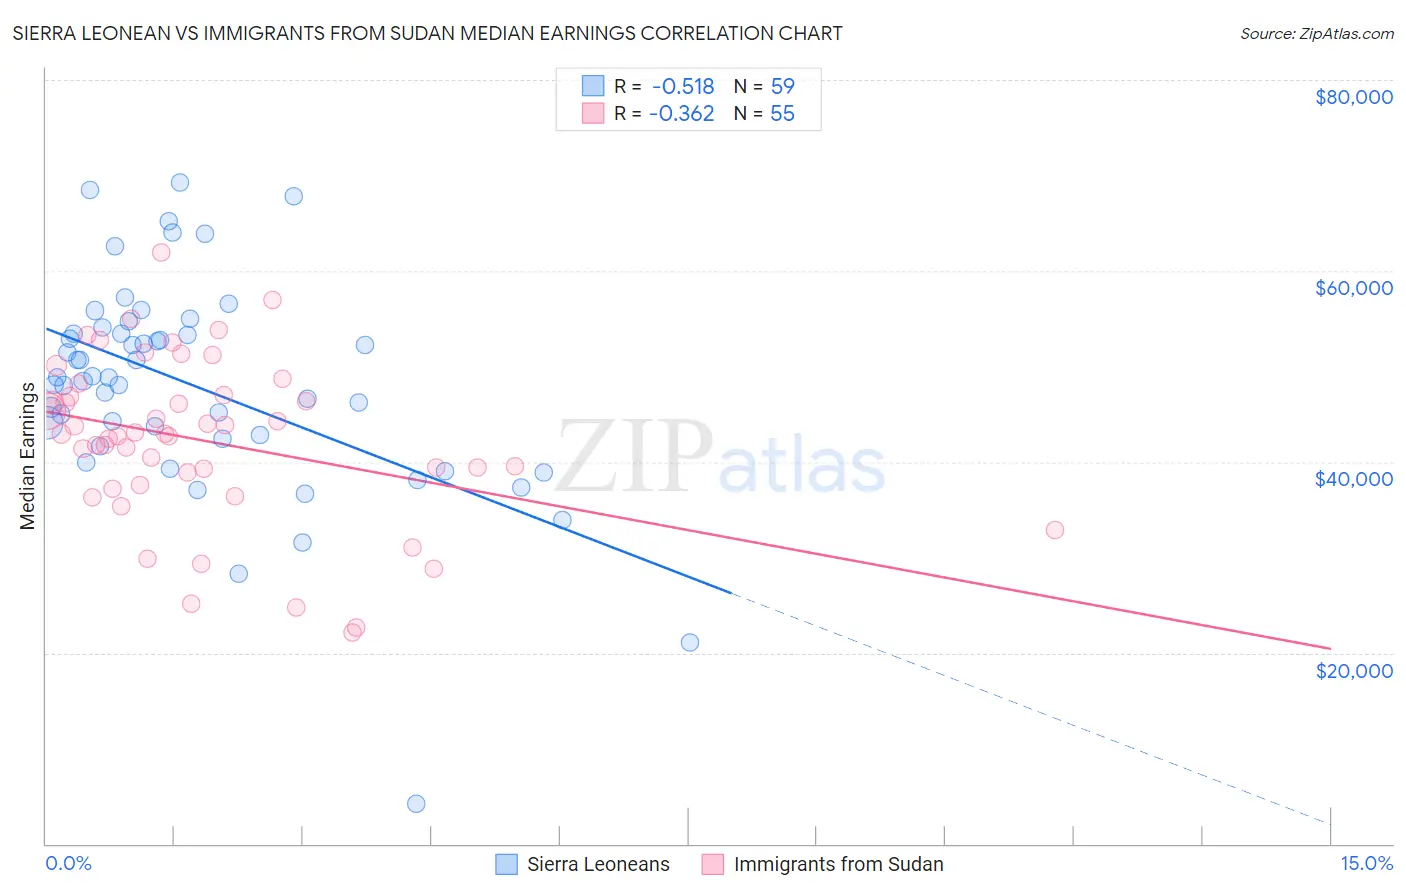
Sierra Leonean vs Immigrants from Sudan Median Earnings Correlation Chart
The statistical analysis conducted on geographies consisting of 83,350,653 people shows a substantial negative correlation between the proportion of Sierra Leoneans and median earnings in the United States with a correlation coefficient (R) of -0.518 and weighted average of $48,286. Similarly, the statistical analysis conducted on geographies consisting of 118,956,438 people shows a mild negative correlation between the proportion of Immigrants from Sudan and median earnings in the United States with a correlation coefficient (R) of -0.362 and weighted average of $44,767, a difference of 7.9%.
Median Earnings Correlation Summary
| Measurement | Sierra Leonean | Immigrants from Sudan |
| Minimum | $4,235 | $22,094 |
| Maximum | $69,241 | $61,886 |
| Range | $65,006 | $39,792 |
| Mean | $47,947 | $42,201 |
| Median | $48,865 | $42,956 |
| Interquartile 25% (IQ1) | $42,439 | $37,545 |
| Interquartile 75% (IQ3) | $53,466 | $47,029 |
| Interquartile Range (IQR) | $11,027 | $9,484 |
| Standard Deviation (Sample) | $11,282 | $8,696 |
| Standard Deviation (Population) | $11,186 | $8,617 |
Similar Demographics by Median Earnings
Demographics Similar to Sierra Leoneans by Median Earnings
In terms of median earnings, the demographic groups most similar to Sierra Leoneans are Immigrants from Fiji ($48,305, a difference of 0.040%), Assyrian/Chaldean/Syriac ($48,304, a difference of 0.040%), Immigrants from Philippines ($48,266, a difference of 0.040%), Pakistani ($48,254, a difference of 0.070%), and Zimbabwean ($48,229, a difference of 0.12%).
| Demographics | Rating | Rank | Median Earnings |
| Carpatho Rusyns | 95.5 /100 | #120 | Exceptional $48,617 |
| Arabs | 95.4 /100 | #121 | Exceptional $48,599 |
| Chileans | 94.8 /100 | #122 | Exceptional $48,504 |
| Immigrants | Syria | 93.9 /100 | #123 | Exceptional $48,375 |
| Brazilians | 93.7 /100 | #124 | Exceptional $48,356 |
| Immigrants | Fiji | 93.3 /100 | #125 | Exceptional $48,305 |
| Assyrians/Chaldeans/Syriacs | 93.3 /100 | #126 | Exceptional $48,304 |
| Sierra Leoneans | 93.1 /100 | #127 | Exceptional $48,286 |
| Immigrants | Philippines | 92.9 /100 | #128 | Exceptional $48,266 |
| Pakistanis | 92.8 /100 | #129 | Exceptional $48,254 |
| Zimbabweans | 92.6 /100 | #130 | Exceptional $48,229 |
| Lebanese | 92.5 /100 | #131 | Exceptional $48,226 |
| British | 92.2 /100 | #132 | Exceptional $48,189 |
| Immigrants | Uganda | 90.5 /100 | #133 | Exceptional $48,041 |
| Sri Lankans | 90.5 /100 | #134 | Exceptional $48,040 |
Demographics Similar to Immigrants from Sudan by Median Earnings
In terms of median earnings, the demographic groups most similar to Immigrants from Sudan are Delaware ($44,783, a difference of 0.040%), Japanese ($44,825, a difference of 0.13%), Immigrants from Western Africa ($44,893, a difference of 0.28%), Cape Verdean ($44,640, a difference of 0.28%), and Scotch-Irish ($44,924, a difference of 0.35%).
| Demographics | Rating | Rank | Median Earnings |
| Immigrants | Nigeria | 12.2 /100 | #226 | Poor $45,030 |
| Native Hawaiians | 12.2 /100 | #227 | Poor $45,027 |
| Immigrants | Iraq | 11.6 /100 | #228 | Poor $44,988 |
| Scotch-Irish | 10.7 /100 | #229 | Poor $44,924 |
| Immigrants | Western Africa | 10.3 /100 | #230 | Poor $44,893 |
| Japanese | 9.5 /100 | #231 | Tragic $44,825 |
| Delaware | 9.0 /100 | #232 | Tragic $44,783 |
| Immigrants | Sudan | 8.8 /100 | #233 | Tragic $44,767 |
| Cape Verdeans | 7.5 /100 | #234 | Tragic $44,640 |
| Venezuelans | 6.9 /100 | #235 | Tragic $44,580 |
| British West Indians | 6.7 /100 | #236 | Tragic $44,552 |
| Immigrants | Ecuador | 5.9 /100 | #237 | Tragic $44,462 |
| Sudanese | 5.6 /100 | #238 | Tragic $44,419 |
| Senegalese | 5.3 /100 | #239 | Tragic $44,373 |
| Aleuts | 4.4 /100 | #240 | Tragic $44,241 |