Paiute vs Asian Median Earnings
COMPARE
Paiute
Asian
Median Earnings
Median Earnings Comparison
Paiute
Asians
$41,508
MEDIAN EARNINGS
0.1/ 100
METRIC RATING
290th/ 347
METRIC RANK
$53,690
MEDIAN EARNINGS
100.0/ 100
METRIC RATING
27th/ 347
METRIC RANK
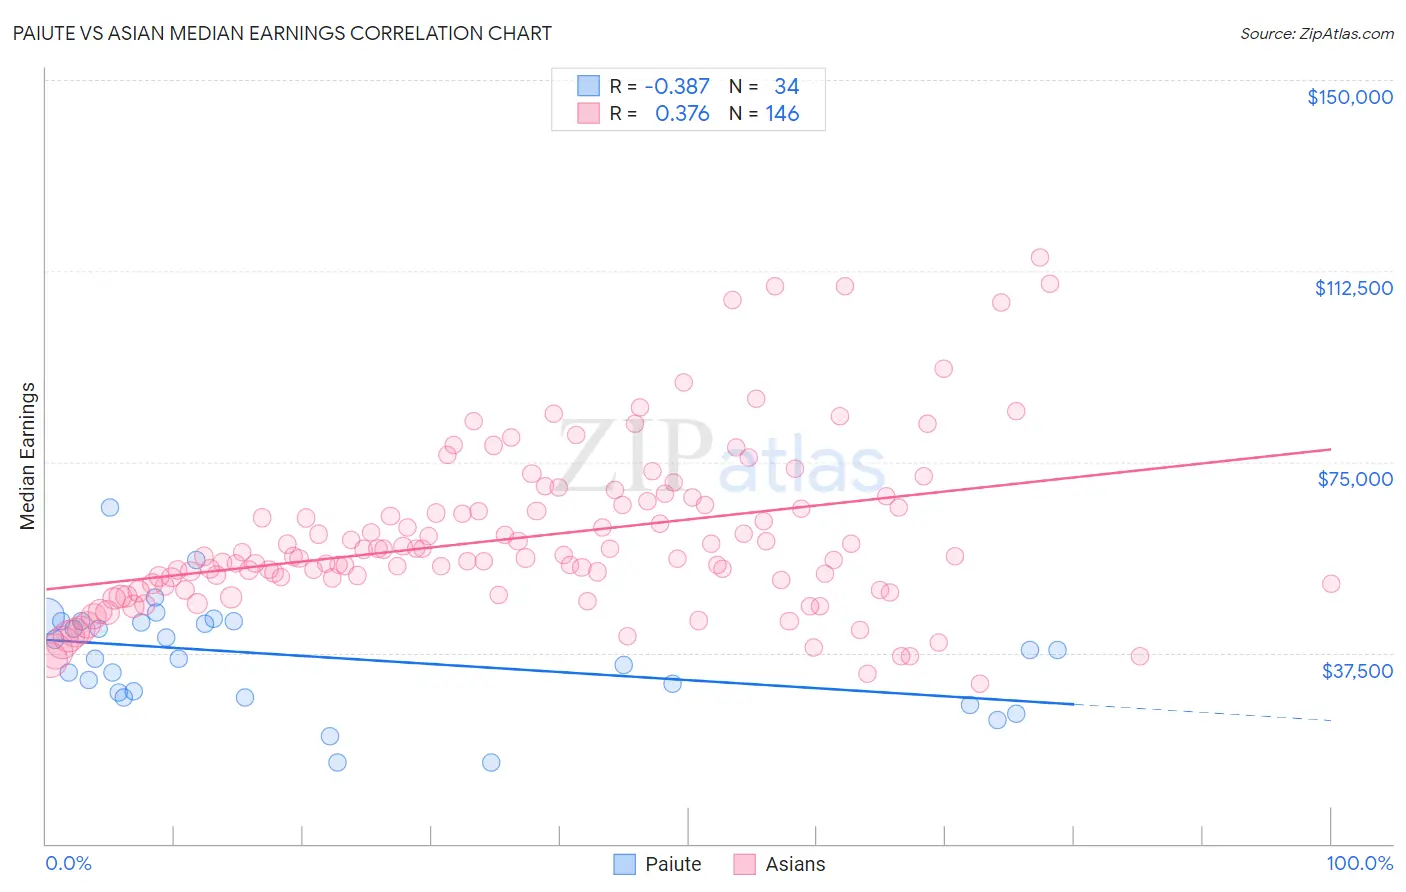
Paiute vs Asian Median Earnings Correlation Chart
The statistical analysis conducted on geographies consisting of 58,401,249 people shows a mild negative correlation between the proportion of Paiute and median earnings in the United States with a correlation coefficient (R) of -0.387 and weighted average of $41,508. Similarly, the statistical analysis conducted on geographies consisting of 550,727,448 people shows a mild positive correlation between the proportion of Asians and median earnings in the United States with a correlation coefficient (R) of 0.376 and weighted average of $53,690, a difference of 29.3%.
Median Earnings Correlation Summary
| Measurement | Paiute | Asian |
| Minimum | $15,859 | $31,416 |
| Maximum | $65,957 | $115,028 |
| Range | $50,098 | $83,612 |
| Mean | $36,753 | $60,136 |
| Median | $37,218 | $56,241 |
| Interquartile 25% (IQ1) | $29,813 | $50,602 |
| Interquartile 75% (IQ3) | $43,606 | $66,425 |
| Interquartile Range (IQR) | $13,793 | $15,823 |
| Standard Deviation (Sample) | $10,514 | $16,173 |
| Standard Deviation (Population) | $10,358 | $16,117 |
Similar Demographics by Median Earnings
Demographics Similar to Paiute by Median Earnings
In terms of median earnings, the demographic groups most similar to Paiute are Comanche ($41,519, a difference of 0.030%), Central American Indian ($41,474, a difference of 0.080%), Immigrants from Dominican Republic ($41,554, a difference of 0.11%), U.S. Virgin Islander ($41,448, a difference of 0.15%), and Immigrants from Zaire ($41,325, a difference of 0.44%).
| Demographics | Rating | Rank | Median Earnings |
| Dominicans | 0.2 /100 | #283 | Tragic $41,864 |
| Blackfeet | 0.2 /100 | #284 | Tragic $41,822 |
| Immigrants | Nicaragua | 0.1 /100 | #285 | Tragic $41,737 |
| Mexican American Indians | 0.1 /100 | #286 | Tragic $41,719 |
| Indonesians | 0.1 /100 | #287 | Tragic $41,701 |
| Immigrants | Dominican Republic | 0.1 /100 | #288 | Tragic $41,554 |
| Comanche | 0.1 /100 | #289 | Tragic $41,519 |
| Paiute | 0.1 /100 | #290 | Tragic $41,508 |
| Central American Indians | 0.1 /100 | #291 | Tragic $41,474 |
| U.S. Virgin Islanders | 0.1 /100 | #292 | Tragic $41,448 |
| Immigrants | Zaire | 0.1 /100 | #293 | Tragic $41,325 |
| Potawatomi | 0.1 /100 | #294 | Tragic $41,288 |
| Bangladeshis | 0.1 /100 | #295 | Tragic $41,263 |
| Cherokee | 0.1 /100 | #296 | Tragic $41,252 |
| Guatemalans | 0.1 /100 | #297 | Tragic $41,205 |
Demographics Similar to Asians by Median Earnings
In terms of median earnings, the demographic groups most similar to Asians are Immigrants from Northern Europe ($53,872, a difference of 0.34%), Immigrants from France ($53,490, a difference of 0.37%), Turkish ($53,919, a difference of 0.43%), Immigrants from Russia ($53,457, a difference of 0.43%), and Cambodian ($53,386, a difference of 0.57%).
| Demographics | Rating | Rank | Median Earnings |
| Cypriots | 100.0 /100 | #20 | Exceptional $54,589 |
| Burmese | 100.0 /100 | #21 | Exceptional $54,559 |
| Immigrants | Korea | 100.0 /100 | #22 | Exceptional $54,530 |
| Immigrants | Sweden | 100.0 /100 | #23 | Exceptional $54,478 |
| Soviet Union | 100.0 /100 | #24 | Exceptional $54,290 |
| Turks | 100.0 /100 | #25 | Exceptional $53,919 |
| Immigrants | Northern Europe | 100.0 /100 | #26 | Exceptional $53,872 |
| Asians | 100.0 /100 | #27 | Exceptional $53,690 |
| Immigrants | France | 100.0 /100 | #28 | Exceptional $53,490 |
| Immigrants | Russia | 100.0 /100 | #29 | Exceptional $53,457 |
| Cambodians | 100.0 /100 | #30 | Exceptional $53,386 |
| Russians | 100.0 /100 | #31 | Exceptional $53,334 |
| Immigrants | Asia | 100.0 /100 | #32 | Exceptional $53,310 |
| Immigrants | Greece | 100.0 /100 | #33 | Exceptional $53,282 |
| Immigrants | Sri Lanka | 100.0 /100 | #34 | Exceptional $53,268 |