Paiute vs Immigrants from Sudan Nursery School
COMPARE
Paiute
Immigrants from Sudan
Nursery School
Nursery School Comparison
Paiute
Immigrants from Sudan
98.0%
NURSERY SCHOOL
42.0/ 100
METRIC RATING
182nd/ 347
METRIC RANK
97.7%
NURSERY SCHOOL
3.9/ 100
METRIC RATING
223rd/ 347
METRIC RANK
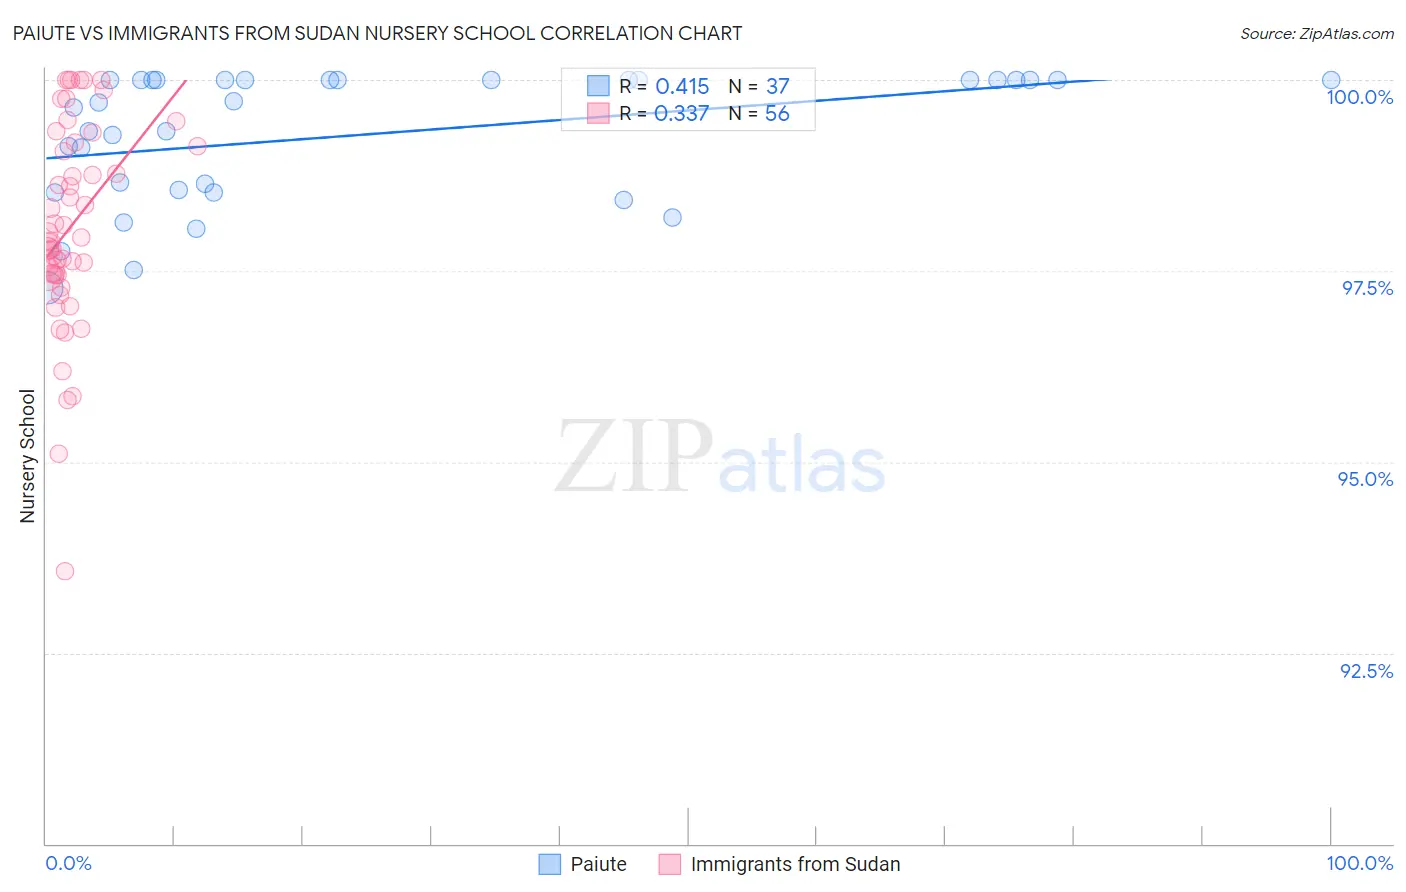
Paiute vs Immigrants from Sudan Nursery School Correlation Chart
The statistical analysis conducted on geographies consisting of 58,402,332 people shows a moderate positive correlation between the proportion of Paiute and percentage of population with at least nursery school education in the United States with a correlation coefficient (R) of 0.415 and weighted average of 98.0%. Similarly, the statistical analysis conducted on geographies consisting of 118,957,985 people shows a mild positive correlation between the proportion of Immigrants from Sudan and percentage of population with at least nursery school education in the United States with a correlation coefficient (R) of 0.337 and weighted average of 97.7%, a difference of 0.22%.
Nursery School Correlation Summary
| Measurement | Paiute | Immigrants from Sudan |
| Minimum | 97.3% | 93.6% |
| Maximum | 100.0% | 100.0% |
| Range | 2.7% | 6.4% |
| Mean | 99.3% | 98.1% |
| Median | 99.7% | 97.9% |
| Interquartile 25% (IQ1) | 98.5% | 97.5% |
| Interquartile 75% (IQ3) | 100.0% | 99.2% |
| Interquartile Range (IQR) | 1.5% | 1.7% |
| Standard Deviation (Sample) | 0.85% | 1.3% |
| Standard Deviation (Population) | 0.84% | 1.3% |
Similar Demographics by Nursery School
Demographics Similar to Paiute by Nursery School
In terms of nursery school, the demographic groups most similar to Paiute are Egyptian (98.0%, a difference of 0.0%), Portuguese (98.0%, a difference of 0.0%), Immigrants from Poland (98.0%, a difference of 0.0%), Immigrants from Belarus (98.0%, a difference of 0.0%), and Immigrants from Argentina (98.0%, a difference of 0.0%).
| Demographics | Rating | Rank | Nursery School |
| Immigrants | Sri Lanka | 49.9 /100 | #175 | Average 98.0% |
| Immigrants | Venezuela | 49.8 /100 | #176 | Average 98.0% |
| Albanians | 48.9 /100 | #177 | Average 98.0% |
| Natives/Alaskans | 48.6 /100 | #178 | Average 98.0% |
| Argentineans | 46.8 /100 | #179 | Average 98.0% |
| Immigrants | Bosnia and Herzegovina | 45.6 /100 | #180 | Average 98.0% |
| Egyptians | 42.8 /100 | #181 | Average 98.0% |
| Paiute | 42.0 /100 | #182 | Average 98.0% |
| Portuguese | 41.8 /100 | #183 | Average 98.0% |
| Immigrants | Poland | 41.3 /100 | #184 | Average 98.0% |
| Immigrants | Belarus | 41.0 /100 | #185 | Average 98.0% |
| Immigrants | Argentina | 40.8 /100 | #186 | Average 98.0% |
| Immigrants | Kazakhstan | 37.1 /100 | #187 | Fair 97.9% |
| Arabs | 34.7 /100 | #188 | Fair 97.9% |
| Pakistanis | 34.6 /100 | #189 | Fair 97.9% |
Demographics Similar to Immigrants from Sudan by Nursery School
In terms of nursery school, the demographic groups most similar to Immigrants from Sudan are Immigrants from Syria (97.7%, a difference of 0.0%), Immigrants from Zaire (97.8%, a difference of 0.010%), Tongan (97.8%, a difference of 0.010%), Immigrants from Nepal (97.7%, a difference of 0.010%), and Immigrants from Costa Rica (97.7%, a difference of 0.010%).
| Demographics | Rating | Rank | Nursery School |
| Uruguayans | 7.1 /100 | #216 | Tragic 97.8% |
| Samoans | 6.3 /100 | #217 | Tragic 97.8% |
| Immigrants | Panama | 5.3 /100 | #218 | Tragic 97.8% |
| Immigrants | Morocco | 5.1 /100 | #219 | Tragic 97.8% |
| Immigrants | Zaire | 4.4 /100 | #220 | Tragic 97.8% |
| Tongans | 4.3 /100 | #221 | Tragic 97.8% |
| Immigrants | Syria | 4.0 /100 | #222 | Tragic 97.7% |
| Immigrants | Sudan | 3.9 /100 | #223 | Tragic 97.7% |
| Immigrants | Nepal | 3.6 /100 | #224 | Tragic 97.7% |
| Immigrants | Costa Rica | 3.5 /100 | #225 | Tragic 97.7% |
| Iraqis | 3.5 /100 | #226 | Tragic 97.7% |
| Sub-Saharan Africans | 3.2 /100 | #227 | Tragic 97.7% |
| Sudanese | 3.2 /100 | #228 | Tragic 97.7% |
| Senegalese | 3.2 /100 | #229 | Tragic 97.7% |
| Sierra Leoneans | 2.9 /100 | #230 | Tragic 97.7% |