Slovene vs Immigrants from Sudan Median Earnings
COMPARE
Slovene
Immigrants from Sudan
Median Earnings
Median Earnings Comparison
Slovenes
Immigrants from Sudan
$47,995
MEDIAN EARNINGS
90.0/ 100
METRIC RATING
136th/ 347
METRIC RANK
$44,767
MEDIAN EARNINGS
8.8/ 100
METRIC RATING
233rd/ 347
METRIC RANK
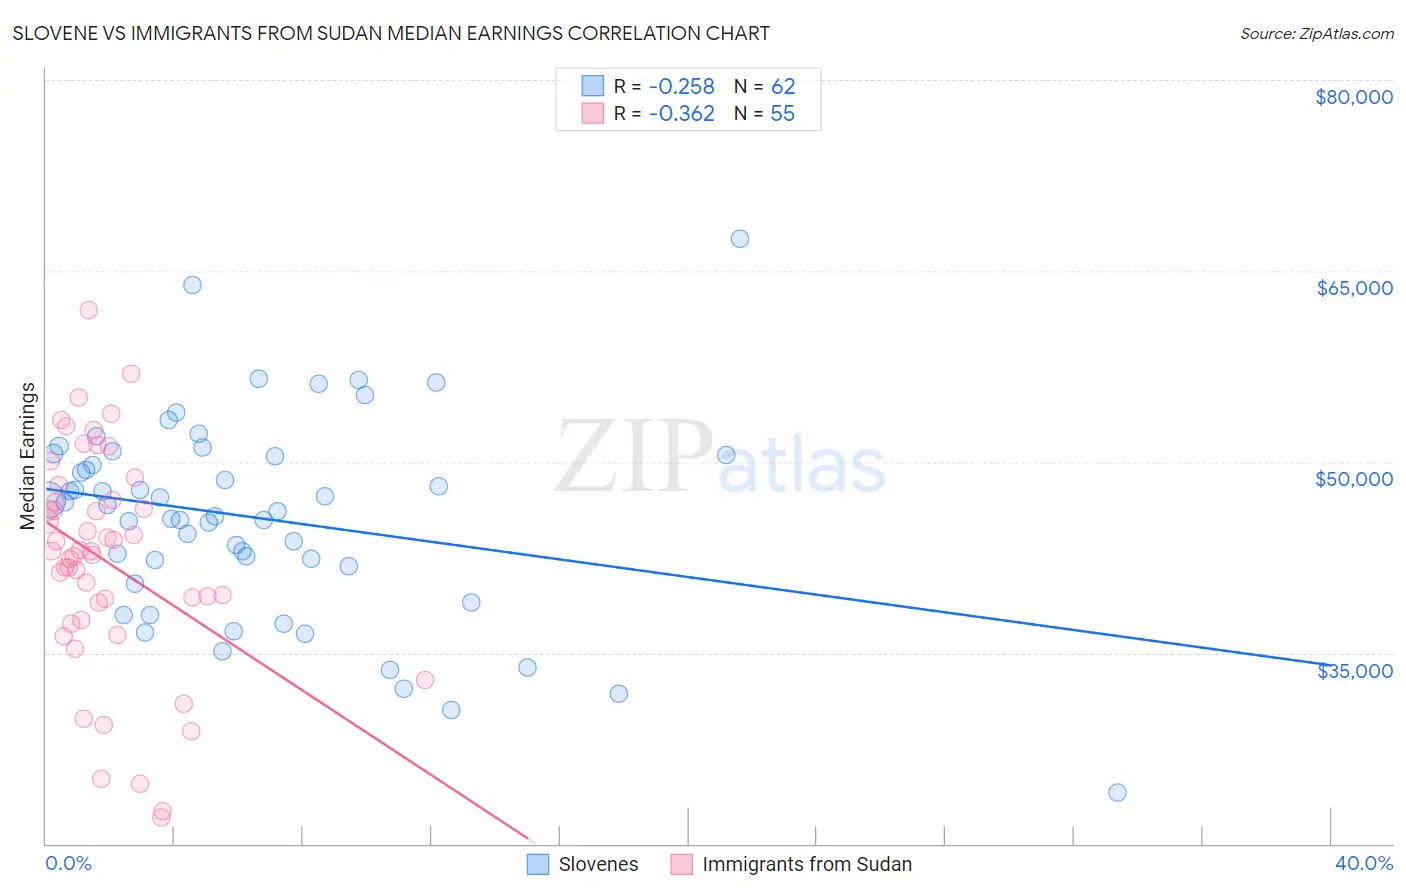
Slovene vs Immigrants from Sudan Median Earnings Correlation Chart
The statistical analysis conducted on geographies consisting of 261,342,703 people shows a weak negative correlation between the proportion of Slovenes and median earnings in the United States with a correlation coefficient (R) of -0.258 and weighted average of $47,995. Similarly, the statistical analysis conducted on geographies consisting of 118,956,438 people shows a mild negative correlation between the proportion of Immigrants from Sudan and median earnings in the United States with a correlation coefficient (R) of -0.362 and weighted average of $44,767, a difference of 7.2%.
Median Earnings Correlation Summary
| Measurement | Slovene | Immigrants from Sudan |
| Minimum | $24,000 | $22,094 |
| Maximum | $67,559 | $61,886 |
| Range | $43,559 | $39,792 |
| Mean | $45,611 | $42,201 |
| Median | $46,389 | $42,956 |
| Interquartile 25% (IQ1) | $41,769 | $37,545 |
| Interquartile 75% (IQ3) | $50,577 | $47,029 |
| Interquartile Range (IQR) | $8,808 | $9,484 |
| Standard Deviation (Sample) | $7,962 | $8,696 |
| Standard Deviation (Population) | $7,897 | $8,617 |
Similar Demographics by Median Earnings
Demographics Similar to Slovenes by Median Earnings
In terms of median earnings, the demographic groups most similar to Slovenes are Portuguese ($48,032, a difference of 0.080%), Sri Lankan ($48,040, a difference of 0.090%), Immigrants from Uganda ($48,041, a difference of 0.10%), Immigrants from Nepal ($47,925, a difference of 0.15%), and European ($47,915, a difference of 0.17%).
| Demographics | Rating | Rank | Median Earnings |
| Pakistanis | 92.8 /100 | #129 | Exceptional $48,254 |
| Zimbabweans | 92.6 /100 | #130 | Exceptional $48,229 |
| Lebanese | 92.5 /100 | #131 | Exceptional $48,226 |
| British | 92.2 /100 | #132 | Exceptional $48,189 |
| Immigrants | Uganda | 90.5 /100 | #133 | Exceptional $48,041 |
| Sri Lankans | 90.5 /100 | #134 | Exceptional $48,040 |
| Portuguese | 90.4 /100 | #135 | Exceptional $48,032 |
| Slovenes | 90.0 /100 | #136 | Excellent $47,995 |
| Immigrants | Nepal | 89.0 /100 | #137 | Excellent $47,925 |
| Europeans | 88.9 /100 | #138 | Excellent $47,915 |
| Canadians | 88.8 /100 | #139 | Excellent $47,911 |
| Taiwanese | 88.7 /100 | #140 | Excellent $47,902 |
| Immigrants | Sierra Leone | 88.3 /100 | #141 | Excellent $47,875 |
| Ugandans | 88.0 /100 | #142 | Excellent $47,854 |
| Swedes | 88.0 /100 | #143 | Excellent $47,851 |
Demographics Similar to Immigrants from Sudan by Median Earnings
In terms of median earnings, the demographic groups most similar to Immigrants from Sudan are Delaware ($44,783, a difference of 0.040%), Japanese ($44,825, a difference of 0.13%), Immigrants from Western Africa ($44,893, a difference of 0.28%), Cape Verdean ($44,640, a difference of 0.28%), and Scotch-Irish ($44,924, a difference of 0.35%).
| Demographics | Rating | Rank | Median Earnings |
| Immigrants | Nigeria | 12.2 /100 | #226 | Poor $45,030 |
| Native Hawaiians | 12.2 /100 | #227 | Poor $45,027 |
| Immigrants | Iraq | 11.6 /100 | #228 | Poor $44,988 |
| Scotch-Irish | 10.7 /100 | #229 | Poor $44,924 |
| Immigrants | Western Africa | 10.3 /100 | #230 | Poor $44,893 |
| Japanese | 9.5 /100 | #231 | Tragic $44,825 |
| Delaware | 9.0 /100 | #232 | Tragic $44,783 |
| Immigrants | Sudan | 8.8 /100 | #233 | Tragic $44,767 |
| Cape Verdeans | 7.5 /100 | #234 | Tragic $44,640 |
| Venezuelans | 6.9 /100 | #235 | Tragic $44,580 |
| British West Indians | 6.7 /100 | #236 | Tragic $44,552 |
| Immigrants | Ecuador | 5.9 /100 | #237 | Tragic $44,462 |
| Sudanese | 5.6 /100 | #238 | Tragic $44,419 |
| Senegalese | 5.3 /100 | #239 | Tragic $44,373 |
| Aleuts | 4.4 /100 | #240 | Tragic $44,241 |