South African vs Immigrants from Sudan Median Earnings
COMPARE
South African
Immigrants from Sudan
Median Earnings
Median Earnings Comparison
South Africans
Immigrants from Sudan
$50,752
MEDIAN EARNINGS
99.8/ 100
METRIC RATING
74th/ 347
METRIC RANK
$44,767
MEDIAN EARNINGS
8.8/ 100
METRIC RATING
233rd/ 347
METRIC RANK
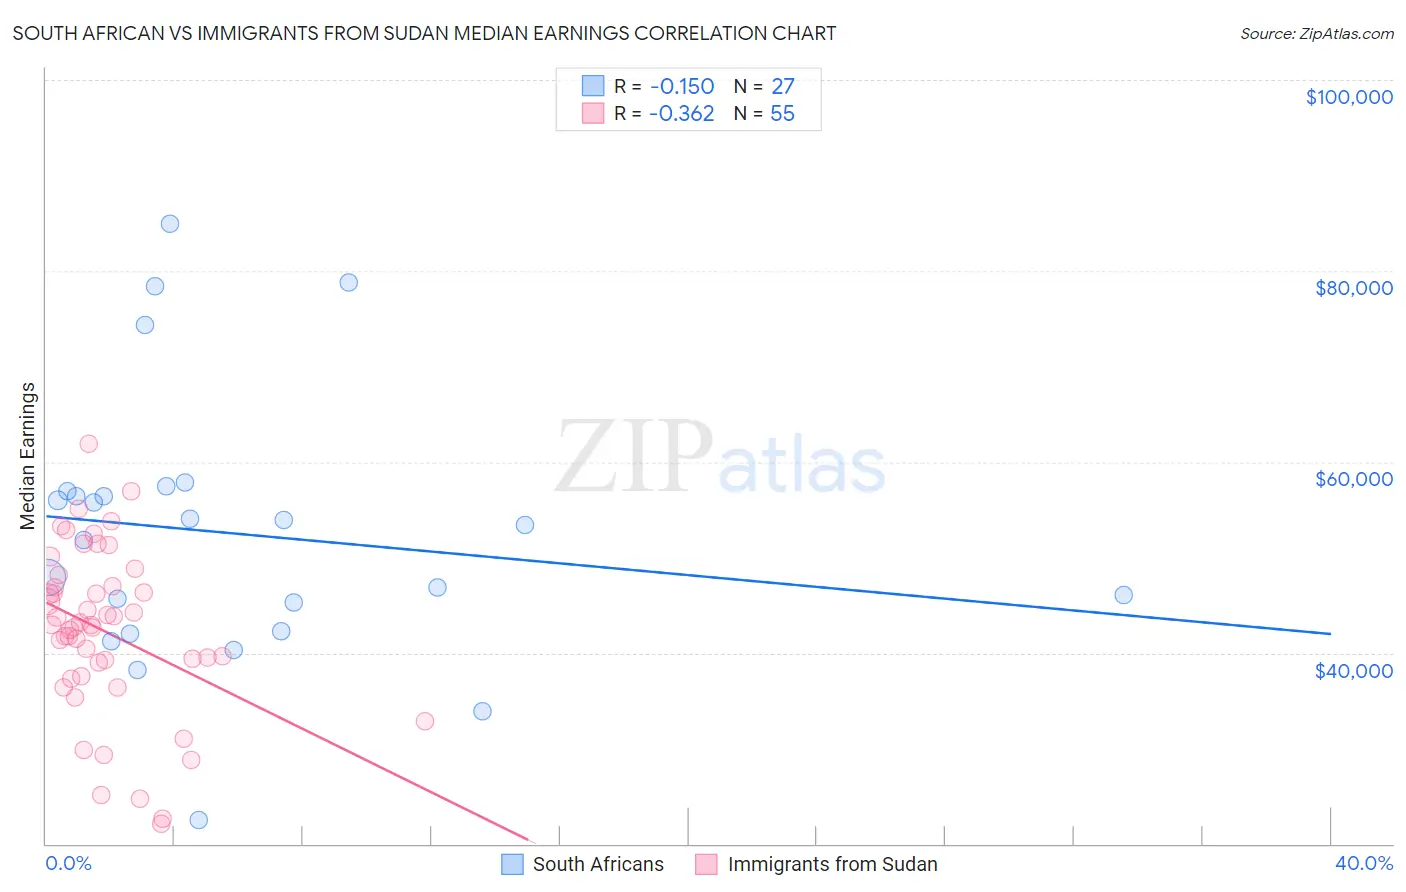
South African vs Immigrants from Sudan Median Earnings Correlation Chart
The statistical analysis conducted on geographies consisting of 182,600,845 people shows a poor negative correlation between the proportion of South Africans and median earnings in the United States with a correlation coefficient (R) of -0.150 and weighted average of $50,752. Similarly, the statistical analysis conducted on geographies consisting of 118,956,438 people shows a mild negative correlation between the proportion of Immigrants from Sudan and median earnings in the United States with a correlation coefficient (R) of -0.362 and weighted average of $44,767, a difference of 13.4%.
Median Earnings Correlation Summary
| Measurement | South African | Immigrants from Sudan |
| Minimum | $22,500 | $22,094 |
| Maximum | $84,919 | $61,886 |
| Range | $62,419 | $39,792 |
| Mean | $52,531 | $42,201 |
| Median | $53,417 | $42,956 |
| Interquartile 25% (IQ1) | $42,247 | $37,545 |
| Interquartile 75% (IQ3) | $56,939 | $47,029 |
| Interquartile Range (IQR) | $14,692 | $9,484 |
| Standard Deviation (Sample) | $14,077 | $8,696 |
| Standard Deviation (Population) | $13,814 | $8,617 |
Similar Demographics by Median Earnings
Demographics Similar to South Africans by Median Earnings
In terms of median earnings, the demographic groups most similar to South Africans are Immigrants from Scotland ($50,741, a difference of 0.020%), Immigrants from Netherlands ($50,818, a difference of 0.13%), Immigrants from Egypt ($50,901, a difference of 0.29%), Immigrants from Italy ($50,581, a difference of 0.34%), and Immigrants from Western Europe ($50,549, a difference of 0.40%).
| Demographics | Rating | Rank | Median Earnings |
| Immigrants | Spain | 99.9 /100 | #67 | Exceptional $51,092 |
| Paraguayans | 99.9 /100 | #68 | Exceptional $51,068 |
| Mongolians | 99.8 /100 | #69 | Exceptional $51,038 |
| Lithuanians | 99.8 /100 | #70 | Exceptional $50,991 |
| Immigrants | Ukraine | 99.8 /100 | #71 | Exceptional $50,984 |
| Immigrants | Egypt | 99.8 /100 | #72 | Exceptional $50,901 |
| Immigrants | Netherlands | 99.8 /100 | #73 | Exceptional $50,818 |
| South Africans | 99.8 /100 | #74 | Exceptional $50,752 |
| Immigrants | Scotland | 99.8 /100 | #75 | Exceptional $50,741 |
| Immigrants | Italy | 99.7 /100 | #76 | Exceptional $50,581 |
| Immigrants | Western Europe | 99.7 /100 | #77 | Exceptional $50,549 |
| Argentineans | 99.6 /100 | #78 | Exceptional $50,399 |
| Laotians | 99.6 /100 | #79 | Exceptional $50,343 |
| Ukrainians | 99.6 /100 | #80 | Exceptional $50,320 |
| Immigrants | Southern Europe | 99.6 /100 | #81 | Exceptional $50,280 |
Demographics Similar to Immigrants from Sudan by Median Earnings
In terms of median earnings, the demographic groups most similar to Immigrants from Sudan are Delaware ($44,783, a difference of 0.040%), Japanese ($44,825, a difference of 0.13%), Immigrants from Western Africa ($44,893, a difference of 0.28%), Cape Verdean ($44,640, a difference of 0.28%), and Scotch-Irish ($44,924, a difference of 0.35%).
| Demographics | Rating | Rank | Median Earnings |
| Immigrants | Nigeria | 12.2 /100 | #226 | Poor $45,030 |
| Native Hawaiians | 12.2 /100 | #227 | Poor $45,027 |
| Immigrants | Iraq | 11.6 /100 | #228 | Poor $44,988 |
| Scotch-Irish | 10.7 /100 | #229 | Poor $44,924 |
| Immigrants | Western Africa | 10.3 /100 | #230 | Poor $44,893 |
| Japanese | 9.5 /100 | #231 | Tragic $44,825 |
| Delaware | 9.0 /100 | #232 | Tragic $44,783 |
| Immigrants | Sudan | 8.8 /100 | #233 | Tragic $44,767 |
| Cape Verdeans | 7.5 /100 | #234 | Tragic $44,640 |
| Venezuelans | 6.9 /100 | #235 | Tragic $44,580 |
| British West Indians | 6.7 /100 | #236 | Tragic $44,552 |
| Immigrants | Ecuador | 5.9 /100 | #237 | Tragic $44,462 |
| Sudanese | 5.6 /100 | #238 | Tragic $44,419 |
| Senegalese | 5.3 /100 | #239 | Tragic $44,373 |
| Aleuts | 4.4 /100 | #240 | Tragic $44,241 |