Spanish American vs Immigrants from Colombia Median Female Earnings
COMPARE
Spanish American
Immigrants from Colombia
Median Female Earnings
Median Female Earnings Comparison
Spanish Americans
Immigrants from Colombia
$36,391
MEDIAN FEMALE EARNINGS
0.1/ 100
METRIC RATING
281st/ 347
METRIC RANK
$38,913
MEDIAN FEMALE EARNINGS
16.3/ 100
METRIC RATING
205th/ 347
METRIC RANK
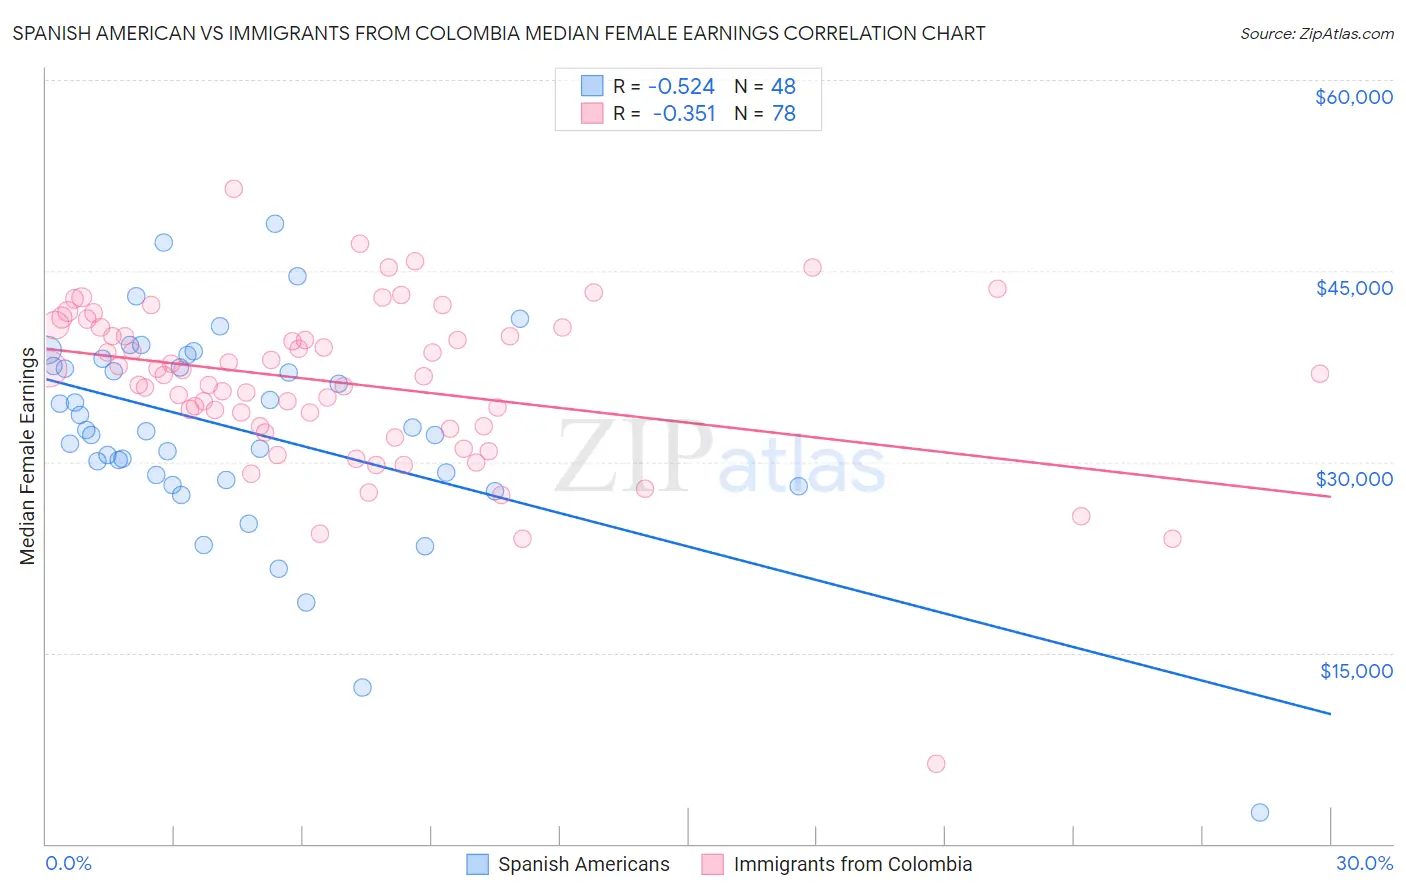
Spanish American vs Immigrants from Colombia Median Female Earnings Correlation Chart
The statistical analysis conducted on geographies consisting of 103,144,133 people shows a substantial negative correlation between the proportion of Spanish Americans and median female earnings in the United States with a correlation coefficient (R) of -0.524 and weighted average of $36,391. Similarly, the statistical analysis conducted on geographies consisting of 378,569,678 people shows a mild negative correlation between the proportion of Immigrants from Colombia and median female earnings in the United States with a correlation coefficient (R) of -0.351 and weighted average of $38,913, a difference of 6.9%.
Median Female Earnings Correlation Summary
| Measurement | Spanish American | Immigrants from Colombia |
| Minimum | $2,499 | $6,250 |
| Maximum | $48,712 | $51,464 |
| Range | $46,213 | $45,214 |
| Mean | $32,492 | $36,175 |
| Median | $32,451 | $36,876 |
| Interquartile 25% (IQ1) | $28,756 | $32,775 |
| Interquartile 75% (IQ3) | $37,829 | $40,514 |
| Interquartile Range (IQR) | $9,073 | $7,739 |
| Standard Deviation (Sample) | $8,307 | $6,580 |
| Standard Deviation (Population) | $8,220 | $6,538 |
Similar Demographics by Median Female Earnings
Demographics Similar to Spanish Americans by Median Female Earnings
In terms of median female earnings, the demographic groups most similar to Spanish Americans are Iroquois ($36,408, a difference of 0.050%), Haitian ($36,374, a difference of 0.050%), Immigrants from Caribbean ($36,414, a difference of 0.060%), U.S. Virgin Islander ($36,424, a difference of 0.090%), and Marshallese ($36,459, a difference of 0.19%).
| Demographics | Rating | Rank | Median Female Earnings |
| Immigrants | El Salvador | 0.2 /100 | #274 | Tragic $36,673 |
| Africans | 0.1 /100 | #275 | Tragic $36,530 |
| Central Americans | 0.1 /100 | #276 | Tragic $36,492 |
| Marshallese | 0.1 /100 | #277 | Tragic $36,459 |
| U.S. Virgin Islanders | 0.1 /100 | #278 | Tragic $36,424 |
| Immigrants | Caribbean | 0.1 /100 | #279 | Tragic $36,414 |
| Iroquois | 0.1 /100 | #280 | Tragic $36,408 |
| Spanish Americans | 0.1 /100 | #281 | Tragic $36,391 |
| Haitians | 0.1 /100 | #282 | Tragic $36,374 |
| Immigrants | Haiti | 0.1 /100 | #283 | Tragic $36,203 |
| Indonesians | 0.1 /100 | #284 | Tragic $36,140 |
| Paiute | 0.1 /100 | #285 | Tragic $36,056 |
| Osage | 0.0 /100 | #286 | Tragic $36,034 |
| Immigrants | Nicaragua | 0.0 /100 | #287 | Tragic $36,023 |
| Immigrants | Zaire | 0.0 /100 | #288 | Tragic $36,017 |
Demographics Similar to Immigrants from Colombia by Median Female Earnings
In terms of median female earnings, the demographic groups most similar to Immigrants from Colombia are Immigrants from Bosnia and Herzegovina ($38,886, a difference of 0.070%), Immigrants from Uruguay ($38,945, a difference of 0.080%), Czech ($38,992, a difference of 0.20%), Immigrants from Cambodia ($38,833, a difference of 0.20%), and Immigrants from Thailand ($38,810, a difference of 0.26%).
| Demographics | Rating | Rank | Median Female Earnings |
| Ecuadorians | 23.0 /100 | #198 | Fair $39,117 |
| Icelanders | 22.7 /100 | #199 | Fair $39,109 |
| Immigrants | Panama | 20.6 /100 | #200 | Fair $39,049 |
| Panamanians | 20.6 /100 | #201 | Fair $39,049 |
| Slovaks | 19.9 /100 | #202 | Poor $39,029 |
| Czechs | 18.7 /100 | #203 | Poor $38,992 |
| Immigrants | Uruguay | 17.3 /100 | #204 | Poor $38,945 |
| Immigrants | Colombia | 16.3 /100 | #205 | Poor $38,913 |
| Immigrants | Bosnia and Herzegovina | 15.6 /100 | #206 | Poor $38,886 |
| Immigrants | Cambodia | 14.2 /100 | #207 | Poor $38,833 |
| Immigrants | Thailand | 13.6 /100 | #208 | Poor $38,810 |
| Norwegians | 13.4 /100 | #209 | Poor $38,802 |
| Czechoslovakians | 12.0 /100 | #210 | Poor $38,738 |
| Aleuts | 11.6 /100 | #211 | Poor $38,719 |
| Guamanians/Chamorros | 11.5 /100 | #212 | Poor $38,717 |