Nepalese vs European Per Capita Income
COMPARE
Nepalese
European
Per Capita Income
Per Capita Income Comparison
Nepalese
Europeans
$38,442
PER CAPITA INCOME
0.3/ 100
METRIC RATING
273rd/ 347
METRIC RANK
$45,836
PER CAPITA INCOME
92.0/ 100
METRIC RATING
124th/ 347
METRIC RANK
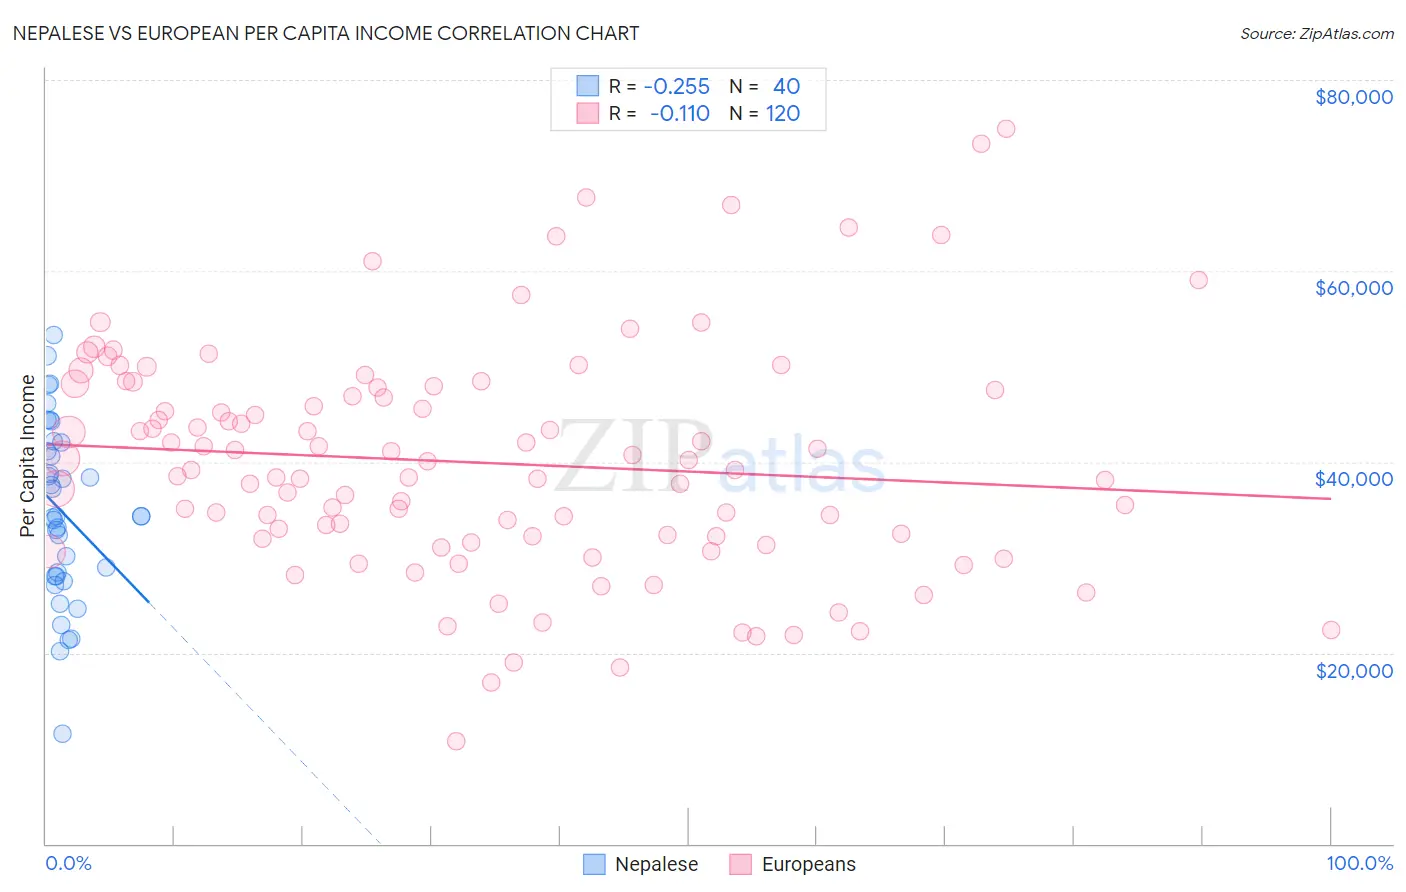
Nepalese vs European Per Capita Income Correlation Chart
The statistical analysis conducted on geographies consisting of 24,521,755 people shows a weak negative correlation between the proportion of Nepalese and per capita income in the United States with a correlation coefficient (R) of -0.255 and weighted average of $38,442. Similarly, the statistical analysis conducted on geographies consisting of 561,881,498 people shows a poor negative correlation between the proportion of Europeans and per capita income in the United States with a correlation coefficient (R) of -0.110 and weighted average of $45,836, a difference of 19.2%.
Per Capita Income Correlation Summary
| Measurement | Nepalese | European |
| Minimum | $11,464 | $10,710 |
| Maximum | $53,263 | $74,913 |
| Range | $41,799 | $64,203 |
| Mean | $34,718 | $39,928 |
| Median | $34,262 | $39,188 |
| Interquartile 25% (IQ1) | $28,014 | $32,091 |
| Interquartile 75% (IQ3) | $41,612 | $47,667 |
| Interquartile Range (IQR) | $13,598 | $15,576 |
| Standard Deviation (Sample) | $9,316 | $11,966 |
| Standard Deviation (Population) | $9,199 | $11,916 |
Similar Demographics by Per Capita Income
Demographics Similar to Nepalese by Per Capita Income
In terms of per capita income, the demographic groups most similar to Nepalese are Immigrants from El Salvador ($38,394, a difference of 0.13%), Immigrants from Cabo Verde ($38,540, a difference of 0.25%), Central American ($38,560, a difference of 0.31%), Immigrants from Belize ($38,614, a difference of 0.45%), and Immigrants from Liberia ($38,165, a difference of 0.73%).
| Demographics | Rating | Rank | Per Capita Income |
| Salvadorans | 0.5 /100 | #266 | Tragic $38,858 |
| Immigrants | Zaire | 0.4 /100 | #267 | Tragic $38,848 |
| Liberians | 0.4 /100 | #268 | Tragic $38,780 |
| Immigrants | Jamaica | 0.4 /100 | #269 | Tragic $38,766 |
| Immigrants | Belize | 0.3 /100 | #270 | Tragic $38,614 |
| Central Americans | 0.3 /100 | #271 | Tragic $38,560 |
| Immigrants | Cabo Verde | 0.3 /100 | #272 | Tragic $38,540 |
| Nepalese | 0.3 /100 | #273 | Tragic $38,442 |
| Immigrants | El Salvador | 0.3 /100 | #274 | Tragic $38,394 |
| Immigrants | Liberia | 0.2 /100 | #275 | Tragic $38,165 |
| Hmong | 0.2 /100 | #276 | Tragic $38,120 |
| Comanche | 0.2 /100 | #277 | Tragic $38,088 |
| Immigrants | Nicaragua | 0.2 /100 | #278 | Tragic $38,065 |
| Colville | 0.2 /100 | #279 | Tragic $38,047 |
| Potawatomi | 0.2 /100 | #280 | Tragic $38,046 |
Demographics Similar to Europeans by Per Capita Income
In terms of per capita income, the demographic groups most similar to Europeans are Lebanese ($45,840, a difference of 0.010%), Moroccan ($45,854, a difference of 0.040%), Canadian ($45,858, a difference of 0.050%), Zimbabwean ($45,804, a difference of 0.070%), and Palestinian ($45,790, a difference of 0.10%).
| Demographics | Rating | Rank | Per Capita Income |
| Chinese | 93.9 /100 | #117 | Exceptional $46,098 |
| Immigrants | Saudi Arabia | 93.3 /100 | #118 | Exceptional $46,008 |
| Immigrants | Poland | 93.1 /100 | #119 | Exceptional $45,979 |
| Immigrants | Ethiopia | 92.7 /100 | #120 | Exceptional $45,923 |
| Canadians | 92.2 /100 | #121 | Exceptional $45,858 |
| Moroccans | 92.1 /100 | #122 | Exceptional $45,854 |
| Lebanese | 92.0 /100 | #123 | Exceptional $45,840 |
| Europeans | 92.0 /100 | #124 | Exceptional $45,836 |
| Zimbabweans | 91.7 /100 | #125 | Exceptional $45,804 |
| Palestinians | 91.6 /100 | #126 | Exceptional $45,790 |
| Immigrants | Germany | 91.3 /100 | #127 | Exceptional $45,751 |
| Swedes | 91.3 /100 | #128 | Exceptional $45,750 |
| Luxembourgers | 90.4 /100 | #129 | Exceptional $45,663 |
| Arabs | 90.4 /100 | #130 | Exceptional $45,662 |
| Immigrants | North Macedonia | 90.0 /100 | #131 | Exceptional $45,622 |