Turkish vs Belgian Median Female Earnings
COMPARE
Turkish
Belgian
Median Female Earnings
Median Female Earnings Comparison
Turks
Belgians
$44,695
MEDIAN FEMALE EARNINGS
100.0/ 100
METRIC RATING
27th/ 347
METRIC RANK
$38,382
MEDIAN FEMALE EARNINGS
6.1/ 100
METRIC RATING
229th/ 347
METRIC RANK
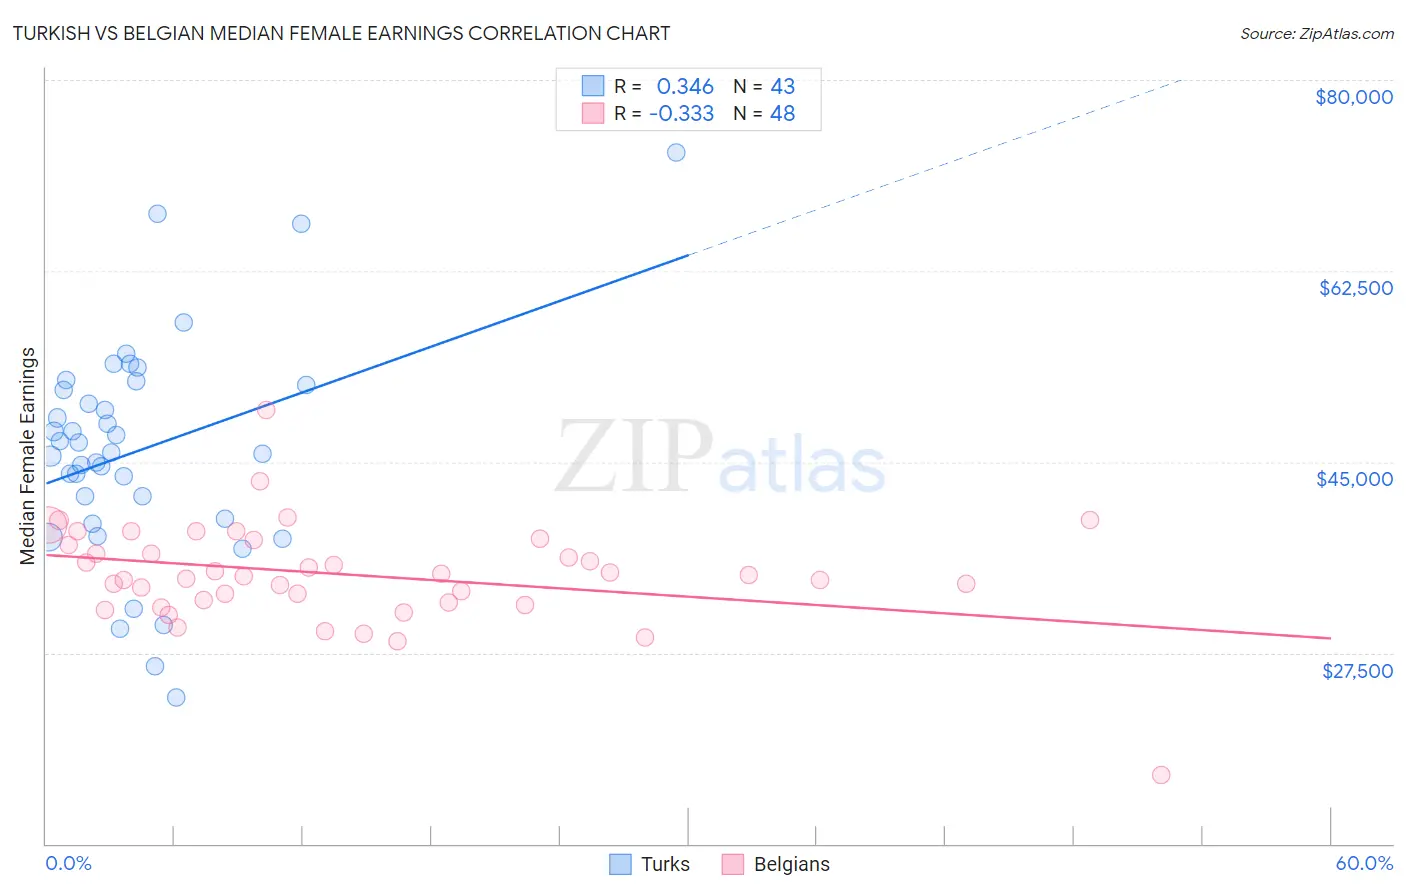
Turkish vs Belgian Median Female Earnings Correlation Chart
The statistical analysis conducted on geographies consisting of 271,816,857 people shows a mild positive correlation between the proportion of Turks and median female earnings in the United States with a correlation coefficient (R) of 0.346 and weighted average of $44,695. Similarly, the statistical analysis conducted on geographies consisting of 355,862,311 people shows a mild negative correlation between the proportion of Belgians and median female earnings in the United States with a correlation coefficient (R) of -0.333 and weighted average of $38,382, a difference of 16.5%.
Median Female Earnings Correlation Summary
| Measurement | Turkish | Belgian |
| Minimum | $23,409 | $16,250 |
| Maximum | $73,333 | $49,724 |
| Range | $49,924 | $33,474 |
| Mean | $46,115 | $34,687 |
| Median | $45,875 | $34,563 |
| Interquartile 25% (IQ1) | $39,746 | $32,227 |
| Interquartile 75% (IQ3) | $52,083 | $37,577 |
| Interquartile Range (IQR) | $12,337 | $5,350 |
| Standard Deviation (Sample) | $10,119 | $4,773 |
| Standard Deviation (Population) | $10,000 | $4,723 |
Similar Demographics by Median Female Earnings
Demographics Similar to Turks by Median Female Earnings
In terms of median female earnings, the demographic groups most similar to Turks are Immigrants from Russia ($44,680, a difference of 0.030%), Immigrants from Belarus ($44,757, a difference of 0.14%), Immigrants from Sweden ($44,774, a difference of 0.18%), Immigrants from Belgium ($44,587, a difference of 0.24%), and Asian ($44,586, a difference of 0.24%).
| Demographics | Rating | Rank | Median Female Earnings |
| Immigrants | Japan | 100.0 /100 | #20 | Exceptional $45,323 |
| Cambodians | 100.0 /100 | #21 | Exceptional $45,014 |
| Immigrants | Greece | 100.0 /100 | #22 | Exceptional $44,976 |
| Burmese | 100.0 /100 | #23 | Exceptional $44,911 |
| Immigrants | Korea | 100.0 /100 | #24 | Exceptional $44,847 |
| Immigrants | Sweden | 100.0 /100 | #25 | Exceptional $44,774 |
| Immigrants | Belarus | 100.0 /100 | #26 | Exceptional $44,757 |
| Turks | 100.0 /100 | #27 | Exceptional $44,695 |
| Immigrants | Russia | 100.0 /100 | #28 | Exceptional $44,680 |
| Immigrants | Belgium | 100.0 /100 | #29 | Exceptional $44,587 |
| Asians | 100.0 /100 | #30 | Exceptional $44,586 |
| Immigrants | France | 100.0 /100 | #31 | Exceptional $44,541 |
| Immigrants | Northern Europe | 100.0 /100 | #32 | Exceptional $44,366 |
| Immigrants | Asia | 100.0 /100 | #33 | Exceptional $44,198 |
| Russians | 100.0 /100 | #34 | Exceptional $44,169 |
Demographics Similar to Belgians by Median Female Earnings
In terms of median female earnings, the demographic groups most similar to Belgians are Subsaharan African ($38,391, a difference of 0.020%), Scottish ($38,397, a difference of 0.040%), Basque ($38,352, a difference of 0.080%), Somali ($38,333, a difference of 0.13%), and French Canadian ($38,436, a difference of 0.14%).
| Demographics | Rating | Rank | Median Female Earnings |
| Japanese | 8.1 /100 | #222 | Tragic $38,528 |
| Immigrants | Sudan | 7.8 /100 | #223 | Tragic $38,511 |
| Native Hawaiians | 7.1 /100 | #224 | Tragic $38,461 |
| French | 7.0 /100 | #225 | Tragic $38,457 |
| French Canadians | 6.8 /100 | #226 | Tragic $38,436 |
| Scottish | 6.3 /100 | #227 | Tragic $38,397 |
| Sub-Saharan Africans | 6.2 /100 | #228 | Tragic $38,391 |
| Belgians | 6.1 /100 | #229 | Tragic $38,382 |
| Basques | 5.7 /100 | #230 | Tragic $38,352 |
| Somalis | 5.5 /100 | #231 | Tragic $38,333 |
| Scandinavians | 5.2 /100 | #232 | Tragic $38,306 |
| Tongans | 5.1 /100 | #233 | Tragic $38,288 |
| Celtics | 5.0 /100 | #234 | Tragic $38,283 |
| Sudanese | 4.4 /100 | #235 | Tragic $38,215 |
| Liberians | 4.4 /100 | #236 | Tragic $38,215 |