Hmong vs Belgian Median Female Earnings
COMPARE
Hmong
Belgian
Median Female Earnings
Median Female Earnings Comparison
Hmong
Belgians
$35,498
MEDIAN FEMALE EARNINGS
0.0/ 100
METRIC RATING
297th/ 347
METRIC RANK
$38,382
MEDIAN FEMALE EARNINGS
6.1/ 100
METRIC RATING
229th/ 347
METRIC RANK
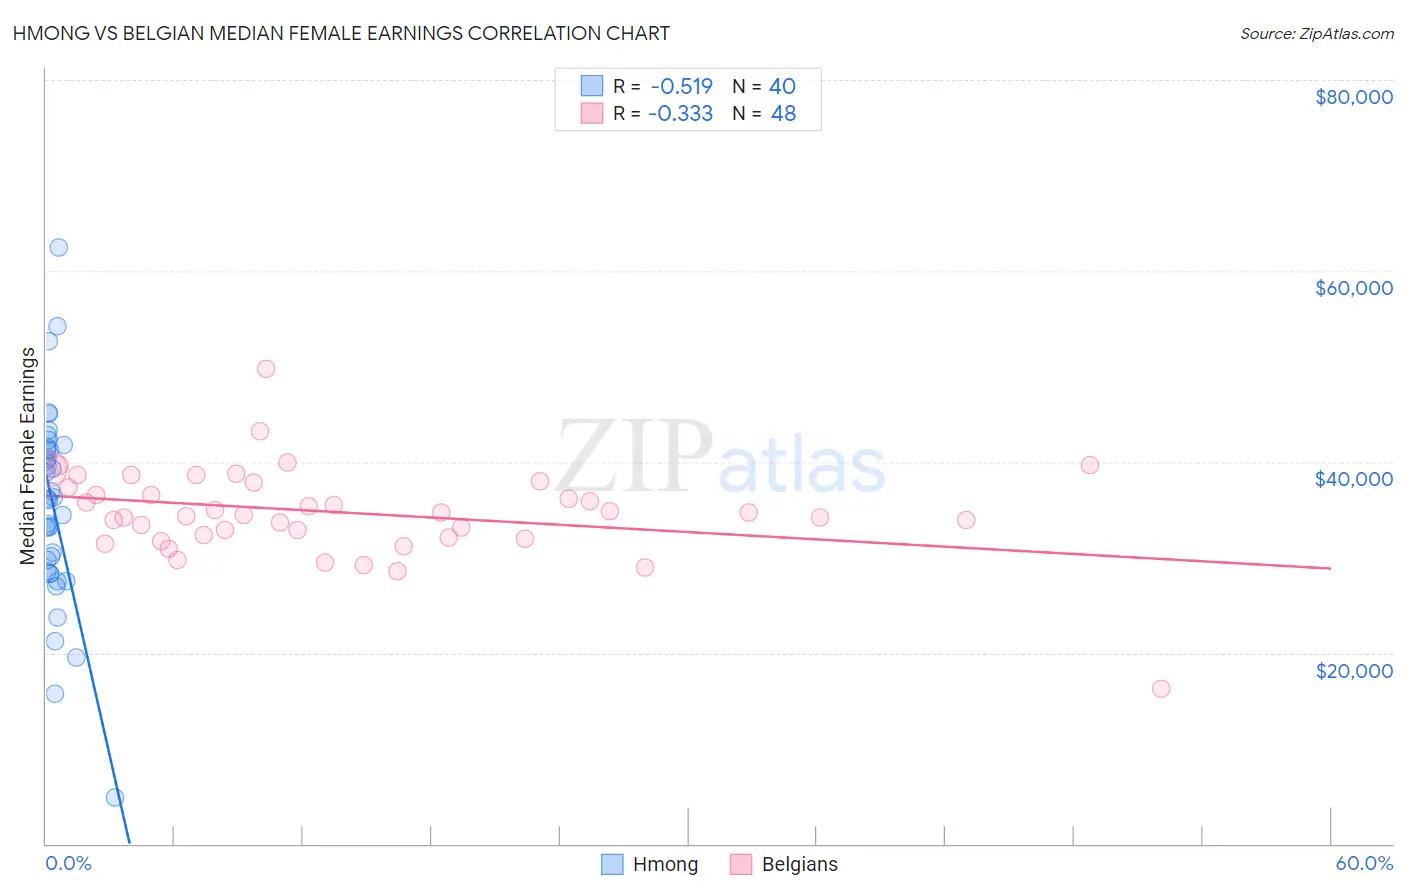
Hmong vs Belgian Median Female Earnings Correlation Chart
The statistical analysis conducted on geographies consisting of 24,681,537 people shows a substantial negative correlation between the proportion of Hmong and median female earnings in the United States with a correlation coefficient (R) of -0.519 and weighted average of $35,498. Similarly, the statistical analysis conducted on geographies consisting of 355,862,311 people shows a mild negative correlation between the proportion of Belgians and median female earnings in the United States with a correlation coefficient (R) of -0.333 and weighted average of $38,382, a difference of 8.1%.
Median Female Earnings Correlation Summary
| Measurement | Hmong | Belgian |
| Minimum | $4,844 | $16,250 |
| Maximum | $62,438 | $49,724 |
| Range | $57,594 | $33,474 |
| Mean | $35,172 | $34,687 |
| Median | $36,091 | $34,563 |
| Interquartile 25% (IQ1) | $28,415 | $32,227 |
| Interquartile 75% (IQ3) | $41,366 | $37,577 |
| Interquartile Range (IQR) | $12,951 | $5,350 |
| Standard Deviation (Sample) | $10,537 | $4,773 |
| Standard Deviation (Population) | $10,404 | $4,723 |
Similar Demographics by Median Female Earnings
Demographics Similar to Hmong by Median Female Earnings
In terms of median female earnings, the demographic groups most similar to Hmong are Immigrants from Micronesia ($35,477, a difference of 0.060%), Immigrants from Guatemala ($35,444, a difference of 0.15%), Yuman ($35,377, a difference of 0.34%), Mexican American Indian ($35,629, a difference of 0.37%), and Comanche ($35,661, a difference of 0.46%).
| Demographics | Rating | Rank | Median Female Earnings |
| Central American Indians | 0.0 /100 | #290 | Tragic $35,930 |
| Blackfeet | 0.0 /100 | #291 | Tragic $35,864 |
| Americans | 0.0 /100 | #292 | Tragic $35,777 |
| Guatemalans | 0.0 /100 | #293 | Tragic $35,695 |
| Cheyenne | 0.0 /100 | #294 | Tragic $35,673 |
| Comanche | 0.0 /100 | #295 | Tragic $35,661 |
| Mexican American Indians | 0.0 /100 | #296 | Tragic $35,629 |
| Hmong | 0.0 /100 | #297 | Tragic $35,498 |
| Immigrants | Micronesia | 0.0 /100 | #298 | Tragic $35,477 |
| Immigrants | Guatemala | 0.0 /100 | #299 | Tragic $35,444 |
| Yuman | 0.0 /100 | #300 | Tragic $35,377 |
| Pima | 0.0 /100 | #301 | Tragic $35,326 |
| Blacks/African Americans | 0.0 /100 | #302 | Tragic $35,315 |
| Immigrants | Latin America | 0.0 /100 | #303 | Tragic $35,307 |
| Crow | 0.0 /100 | #304 | Tragic $35,266 |
Demographics Similar to Belgians by Median Female Earnings
In terms of median female earnings, the demographic groups most similar to Belgians are Subsaharan African ($38,391, a difference of 0.020%), Scottish ($38,397, a difference of 0.040%), Basque ($38,352, a difference of 0.080%), Somali ($38,333, a difference of 0.13%), and French Canadian ($38,436, a difference of 0.14%).
| Demographics | Rating | Rank | Median Female Earnings |
| Japanese | 8.1 /100 | #222 | Tragic $38,528 |
| Immigrants | Sudan | 7.8 /100 | #223 | Tragic $38,511 |
| Native Hawaiians | 7.1 /100 | #224 | Tragic $38,461 |
| French | 7.0 /100 | #225 | Tragic $38,457 |
| French Canadians | 6.8 /100 | #226 | Tragic $38,436 |
| Scottish | 6.3 /100 | #227 | Tragic $38,397 |
| Sub-Saharan Africans | 6.2 /100 | #228 | Tragic $38,391 |
| Belgians | 6.1 /100 | #229 | Tragic $38,382 |
| Basques | 5.7 /100 | #230 | Tragic $38,352 |
| Somalis | 5.5 /100 | #231 | Tragic $38,333 |
| Scandinavians | 5.2 /100 | #232 | Tragic $38,306 |
| Tongans | 5.1 /100 | #233 | Tragic $38,288 |
| Celtics | 5.0 /100 | #234 | Tragic $38,283 |
| Sudanese | 4.4 /100 | #235 | Tragic $38,215 |
| Liberians | 4.4 /100 | #236 | Tragic $38,215 |