Immigrants from Ethiopia vs Syrian Median Male Earnings
COMPARE
Immigrants from Ethiopia
Syrian
Median Male Earnings
Median Male Earnings Comparison
Immigrants from Ethiopia
Syrians
$55,434
MEDIAN MALE EARNINGS
71.6/ 100
METRIC RATING
156th/ 347
METRIC RANK
$58,187
MEDIAN MALE EARNINGS
97.4/ 100
METRIC RATING
102nd/ 347
METRIC RANK
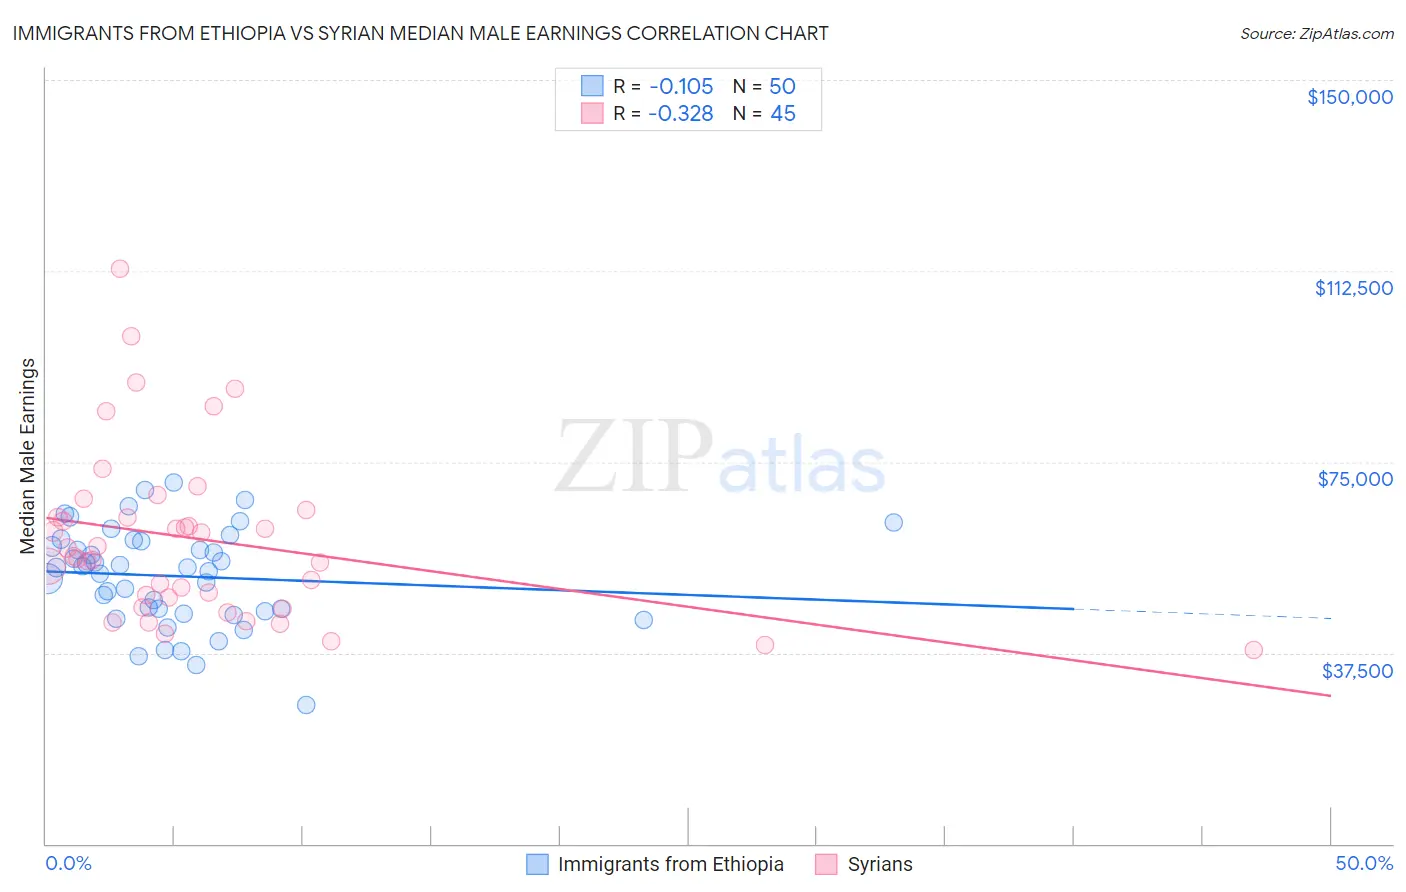
Immigrants from Ethiopia vs Syrian Median Male Earnings Correlation Chart
The statistical analysis conducted on geographies consisting of 211,550,468 people shows a poor negative correlation between the proportion of Immigrants from Ethiopia and median male earnings in the United States with a correlation coefficient (R) of -0.105 and weighted average of $55,434. Similarly, the statistical analysis conducted on geographies consisting of 266,273,099 people shows a mild negative correlation between the proportion of Syrians and median male earnings in the United States with a correlation coefficient (R) of -0.328 and weighted average of $58,187, a difference of 5.0%.
Median Male Earnings Correlation Summary
| Measurement | Immigrants from Ethiopia | Syrian |
| Minimum | $27,233 | $38,125 |
| Maximum | $70,982 | $112,858 |
| Range | $43,749 | $74,733 |
| Mean | $52,533 | $59,779 |
| Median | $54,177 | $56,452 |
| Interquartile 25% (IQ1) | $45,679 | $47,297 |
| Interquartile 75% (IQ3) | $59,341 | $64,910 |
| Interquartile Range (IQR) | $13,662 | $17,614 |
| Standard Deviation (Sample) | $9,594 | $16,573 |
| Standard Deviation (Population) | $9,497 | $16,388 |
Similar Demographics by Median Male Earnings
Demographics Similar to Immigrants from Ethiopia by Median Male Earnings
In terms of median male earnings, the demographic groups most similar to Immigrants from Ethiopia are Icelander ($55,415, a difference of 0.030%), Czechoslovakian ($55,382, a difference of 0.090%), Alsatian ($55,380, a difference of 0.10%), Basque ($55,370, a difference of 0.12%), and Belgian ($55,361, a difference of 0.13%).
| Demographics | Rating | Rank | Median Male Earnings |
| English | 77.4 /100 | #149 | Good $55,747 |
| Swiss | 77.1 /100 | #150 | Good $55,731 |
| Immigrants | Oceania | 76.8 /100 | #151 | Good $55,712 |
| Peruvians | 75.8 /100 | #152 | Good $55,659 |
| Immigrants | Nepal | 75.0 /100 | #153 | Good $55,615 |
| Taiwanese | 73.9 /100 | #154 | Good $55,556 |
| Scandinavians | 73.4 /100 | #155 | Good $55,527 |
| Immigrants | Ethiopia | 71.6 /100 | #156 | Good $55,434 |
| Icelanders | 71.2 /100 | #157 | Good $55,415 |
| Czechoslovakians | 70.5 /100 | #158 | Good $55,382 |
| Alsatians | 70.5 /100 | #159 | Good $55,380 |
| Basques | 70.3 /100 | #160 | Good $55,370 |
| Belgians | 70.1 /100 | #161 | Good $55,361 |
| French | 69.9 /100 | #162 | Good $55,350 |
| Ugandans | 68.6 /100 | #163 | Good $55,290 |
Demographics Similar to Syrians by Median Male Earnings
In terms of median male earnings, the demographic groups most similar to Syrians are Polish ($58,139, a difference of 0.080%), Armenian ($58,134, a difference of 0.090%), Immigrants from Western Asia ($58,131, a difference of 0.10%), Immigrants from Brazil ($58,324, a difference of 0.24%), and Immigrants from Northern Africa ($58,008, a difference of 0.31%).
| Demographics | Rating | Rank | Median Male Earnings |
| Immigrants | Lebanon | 98.6 /100 | #95 | Exceptional $58,835 |
| Albanians | 98.4 /100 | #96 | Exceptional $58,680 |
| Northern Europeans | 98.2 /100 | #97 | Exceptional $58,588 |
| Jordanians | 98.1 /100 | #98 | Exceptional $58,500 |
| Immigrants | Poland | 98.0 /100 | #99 | Exceptional $58,452 |
| Assyrians/Chaldeans/Syriacs | 97.9 /100 | #100 | Exceptional $58,437 |
| Immigrants | Brazil | 97.7 /100 | #101 | Exceptional $58,324 |
| Syrians | 97.4 /100 | #102 | Exceptional $58,187 |
| Poles | 97.3 /100 | #103 | Exceptional $58,139 |
| Armenians | 97.3 /100 | #104 | Exceptional $58,134 |
| Immigrants | Western Asia | 97.3 /100 | #105 | Exceptional $58,131 |
| Immigrants | Northern Africa | 96.9 /100 | #106 | Exceptional $58,008 |
| Serbians | 96.8 /100 | #107 | Exceptional $57,975 |
| Immigrants | Uzbekistan | 96.7 /100 | #108 | Exceptional $57,941 |
| British | 96.5 /100 | #109 | Exceptional $57,890 |