Nepalese vs Syrian Median Male Earnings
COMPARE
Nepalese
Syrian
Median Male Earnings
Median Male Earnings Comparison
Nepalese
Syrians
$49,458
MEDIAN MALE EARNINGS
0.7/ 100
METRIC RATING
259th/ 347
METRIC RANK
$58,187
MEDIAN MALE EARNINGS
97.4/ 100
METRIC RATING
102nd/ 347
METRIC RANK
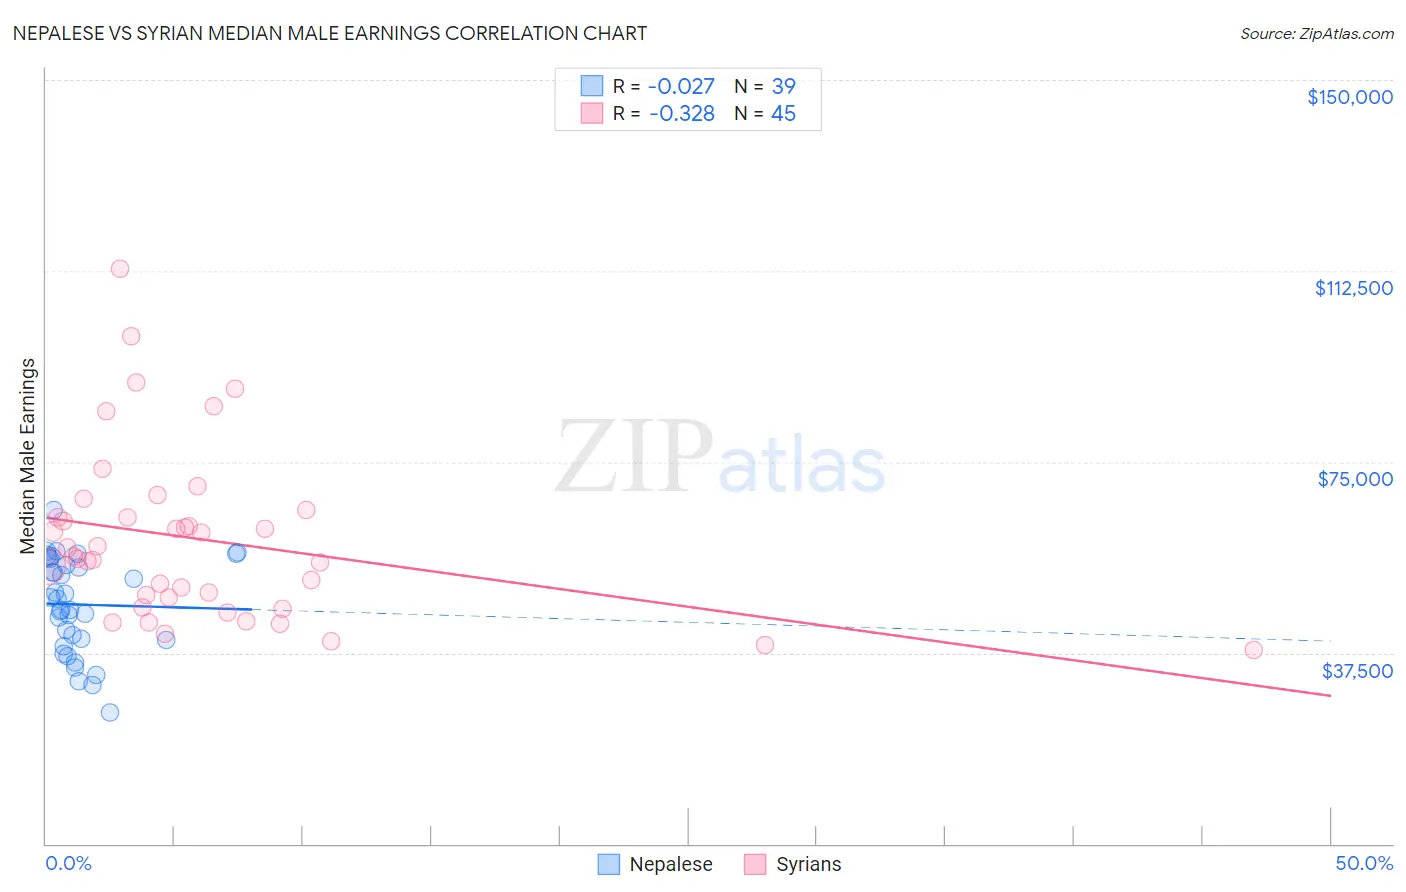
Nepalese vs Syrian Median Male Earnings Correlation Chart
The statistical analysis conducted on geographies consisting of 24,431,712 people shows no correlation between the proportion of Nepalese and median male earnings in the United States with a correlation coefficient (R) of -0.027 and weighted average of $49,458. Similarly, the statistical analysis conducted on geographies consisting of 266,273,099 people shows a mild negative correlation between the proportion of Syrians and median male earnings in the United States with a correlation coefficient (R) of -0.328 and weighted average of $58,187, a difference of 17.6%.
Median Male Earnings Correlation Summary
| Measurement | Nepalese | Syrian |
| Minimum | $25,893 | $38,125 |
| Maximum | $65,607 | $112,858 |
| Range | $39,714 | $74,733 |
| Mean | $46,984 | $59,779 |
| Median | $48,060 | $56,452 |
| Interquartile 25% (IQ1) | $40,000 | $47,297 |
| Interquartile 75% (IQ3) | $56,086 | $64,910 |
| Interquartile Range (IQR) | $16,086 | $17,614 |
| Standard Deviation (Sample) | $9,323 | $16,573 |
| Standard Deviation (Population) | $9,202 | $16,388 |
Similar Demographics by Median Male Earnings
Demographics Similar to Nepalese by Median Male Earnings
In terms of median male earnings, the demographic groups most similar to Nepalese are Cree ($49,497, a difference of 0.080%), Iroquois ($49,374, a difference of 0.17%), Liberian ($49,318, a difference of 0.28%), British West Indian ($49,636, a difference of 0.36%), and Immigrants from West Indies ($49,271, a difference of 0.38%).
| Demographics | Rating | Rank | Median Male Earnings |
| Immigrants | Cabo Verde | 1.2 /100 | #252 | Tragic $50,009 |
| German Russians | 1.1 /100 | #253 | Tragic $49,924 |
| Senegalese | 1.0 /100 | #254 | Tragic $49,774 |
| Alaskan Athabascans | 0.9 /100 | #255 | Tragic $49,748 |
| Alaska Natives | 0.9 /100 | #256 | Tragic $49,711 |
| British West Indians | 0.8 /100 | #257 | Tragic $49,636 |
| Cree | 0.7 /100 | #258 | Tragic $49,497 |
| Nepalese | 0.7 /100 | #259 | Tragic $49,458 |
| Iroquois | 0.7 /100 | #260 | Tragic $49,374 |
| Liberians | 0.6 /100 | #261 | Tragic $49,318 |
| Immigrants | West Indies | 0.6 /100 | #262 | Tragic $49,271 |
| Nicaraguans | 0.6 /100 | #263 | Tragic $49,215 |
| Immigrants | Middle Africa | 0.6 /100 | #264 | Tragic $49,201 |
| Immigrants | Laos | 0.6 /100 | #265 | Tragic $49,190 |
| Somalis | 0.5 /100 | #266 | Tragic $49,025 |
Demographics Similar to Syrians by Median Male Earnings
In terms of median male earnings, the demographic groups most similar to Syrians are Polish ($58,139, a difference of 0.080%), Armenian ($58,134, a difference of 0.090%), Immigrants from Western Asia ($58,131, a difference of 0.10%), Immigrants from Brazil ($58,324, a difference of 0.24%), and Immigrants from Northern Africa ($58,008, a difference of 0.31%).
| Demographics | Rating | Rank | Median Male Earnings |
| Immigrants | Lebanon | 98.6 /100 | #95 | Exceptional $58,835 |
| Albanians | 98.4 /100 | #96 | Exceptional $58,680 |
| Northern Europeans | 98.2 /100 | #97 | Exceptional $58,588 |
| Jordanians | 98.1 /100 | #98 | Exceptional $58,500 |
| Immigrants | Poland | 98.0 /100 | #99 | Exceptional $58,452 |
| Assyrians/Chaldeans/Syriacs | 97.9 /100 | #100 | Exceptional $58,437 |
| Immigrants | Brazil | 97.7 /100 | #101 | Exceptional $58,324 |
| Syrians | 97.4 /100 | #102 | Exceptional $58,187 |
| Poles | 97.3 /100 | #103 | Exceptional $58,139 |
| Armenians | 97.3 /100 | #104 | Exceptional $58,134 |
| Immigrants | Western Asia | 97.3 /100 | #105 | Exceptional $58,131 |
| Immigrants | Northern Africa | 96.9 /100 | #106 | Exceptional $58,008 |
| Serbians | 96.8 /100 | #107 | Exceptional $57,975 |
| Immigrants | Uzbekistan | 96.7 /100 | #108 | Exceptional $57,941 |
| British | 96.5 /100 | #109 | Exceptional $57,890 |