Native/Alaskan vs Syrian Female Poverty Among 25-34 Year Olds
COMPARE
Native/Alaskan
Syrian
Female Poverty Among 25-34 Year Olds
Female Poverty Among 25-34 Year Olds Comparison
Natives/Alaskans
Syrians
20.3%
FEMALE POVERTY AMONG 25-34 YEAR OLDS
0.0/ 100
METRIC RATING
335th/ 347
METRIC RANK
12.9%
FEMALE POVERTY AMONG 25-34 YEAR OLDS
90.2/ 100
METRIC RATING
128th/ 347
METRIC RANK
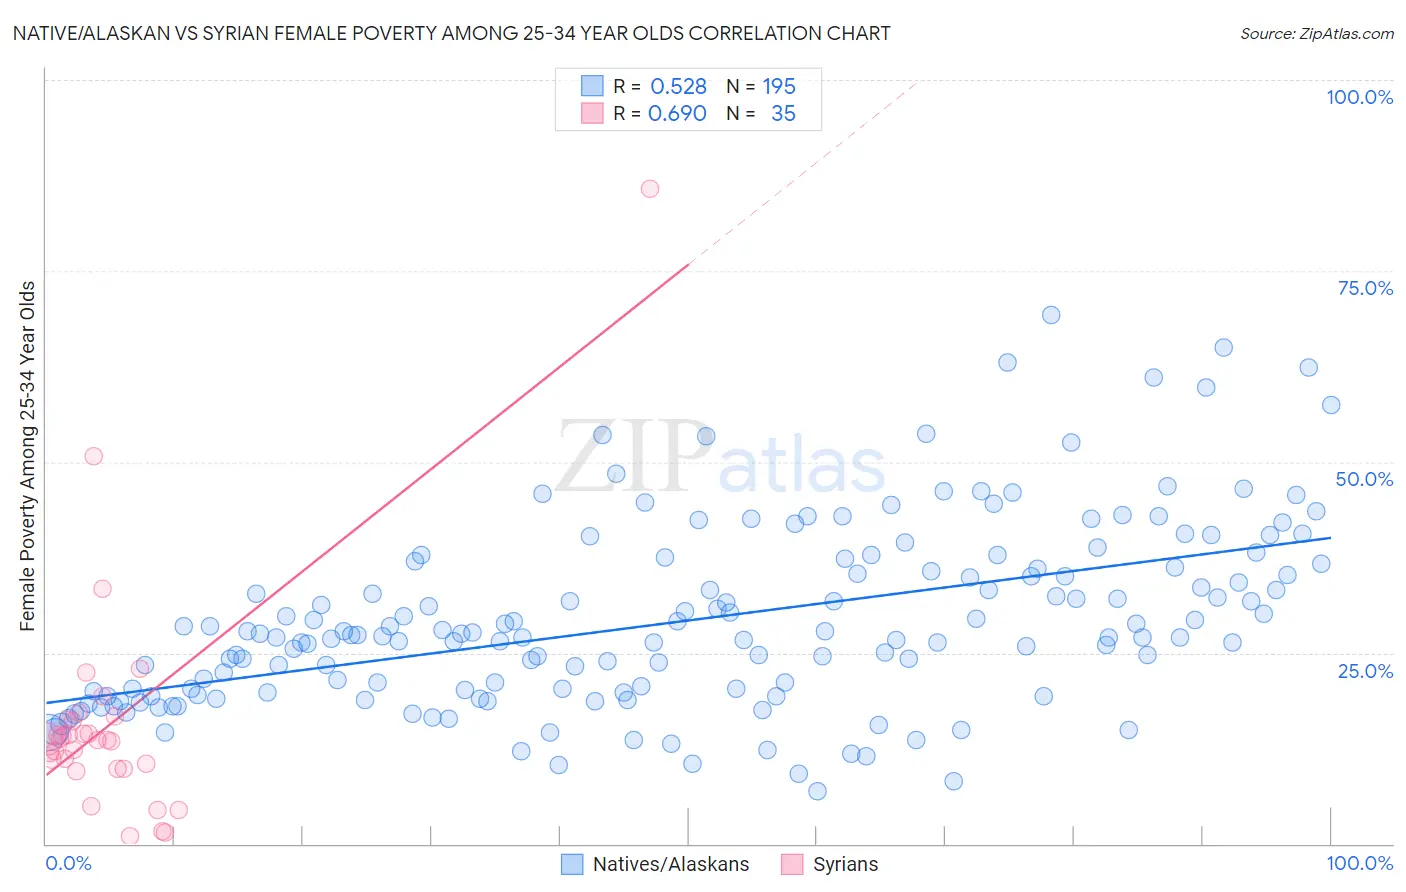
Native/Alaskan vs Syrian Female Poverty Among 25-34 Year Olds Correlation Chart
The statistical analysis conducted on geographies consisting of 501,642,469 people shows a substantial positive correlation between the proportion of Natives/Alaskans and poverty level among females between the ages 25 and 34 in the United States with a correlation coefficient (R) of 0.528 and weighted average of 20.3%. Similarly, the statistical analysis conducted on geographies consisting of 262,724,041 people shows a significant positive correlation between the proportion of Syrians and poverty level among females between the ages 25 and 34 in the United States with a correlation coefficient (R) of 0.690 and weighted average of 12.9%, a difference of 57.2%.
Female Poverty Among 25-34 Year Olds Correlation Summary
| Measurement | Native/Alaskan | Syrian |
| Minimum | 6.9% | 0.91% |
| Maximum | 69.3% | 85.7% |
| Range | 62.4% | 84.8% |
| Mean | 29.2% | 15.9% |
| Median | 27.1% | 13.5% |
| Interquartile 25% (IQ1) | 19.8% | 9.9% |
| Interquartile 75% (IQ3) | 36.0% | 16.2% |
| Interquartile Range (IQR) | 16.2% | 6.3% |
| Standard Deviation (Sample) | 11.9% | 15.1% |
| Standard Deviation (Population) | 11.9% | 14.9% |
Similar Demographics by Female Poverty Among 25-34 Year Olds
Demographics Similar to Natives/Alaskans by Female Poverty Among 25-34 Year Olds
In terms of female poverty among 25-34 year olds, the demographic groups most similar to Natives/Alaskans are Apache (20.1%, a difference of 1.1%), Cajun (19.9%, a difference of 1.8%), Immigrants from Yemen (19.8%, a difference of 2.6%), Kiowa (19.7%, a difference of 3.2%), and Paiute (19.6%, a difference of 3.6%).
| Demographics | Rating | Rank | Female Poverty Among 25-34 Year Olds |
| Alaskan Athabascans | 0.0 /100 | #328 | Tragic 19.1% |
| Creek | 0.0 /100 | #329 | Tragic 19.2% |
| Paiute | 0.0 /100 | #330 | Tragic 19.6% |
| Kiowa | 0.0 /100 | #331 | Tragic 19.7% |
| Immigrants | Yemen | 0.0 /100 | #332 | Tragic 19.8% |
| Cajuns | 0.0 /100 | #333 | Tragic 19.9% |
| Apache | 0.0 /100 | #334 | Tragic 20.1% |
| Natives/Alaskans | 0.0 /100 | #335 | Tragic 20.3% |
| Pueblo | 0.0 /100 | #336 | Tragic 22.2% |
| Crow | 0.0 /100 | #337 | Tragic 22.7% |
| Houma | 0.0 /100 | #338 | Tragic 22.7% |
| Yuman | 0.0 /100 | #339 | Tragic 22.9% |
| Sioux | 0.0 /100 | #340 | Tragic 23.0% |
| Navajo | 0.0 /100 | #341 | Tragic 23.3% |
| Hopi | 0.0 /100 | #342 | Tragic 23.7% |
Demographics Similar to Syrians by Female Poverty Among 25-34 Year Olds
In terms of female poverty among 25-34 year olds, the demographic groups most similar to Syrians are Czech (12.9%, a difference of 0.020%), Immigrants from North America (12.9%, a difference of 0.12%), Immigrants from Uzbekistan (12.9%, a difference of 0.14%), Immigrants from Fiji (12.9%, a difference of 0.25%), and Immigrants from Canada (12.9%, a difference of 0.33%).
| Demographics | Rating | Rank | Female Poverty Among 25-34 Year Olds |
| Romanians | 92.8 /100 | #121 | Exceptional 12.8% |
| Immigrants | Western Asia | 92.7 /100 | #122 | Exceptional 12.8% |
| Slovenes | 92.7 /100 | #123 | Exceptional 12.8% |
| Immigrants | Netherlands | 92.0 /100 | #124 | Exceptional 12.8% |
| Immigrants | Canada | 91.5 /100 | #125 | Exceptional 12.9% |
| Immigrants | Fiji | 91.2 /100 | #126 | Exceptional 12.9% |
| Czechs | 90.3 /100 | #127 | Exceptional 12.9% |
| Syrians | 90.2 /100 | #128 | Exceptional 12.9% |
| Immigrants | North America | 89.7 /100 | #129 | Excellent 12.9% |
| Immigrants | Uzbekistan | 89.6 /100 | #130 | Excellent 12.9% |
| Pakistanis | 88.4 /100 | #131 | Excellent 13.0% |
| Immigrants | Hungary | 88.3 /100 | #132 | Excellent 13.0% |
| Serbians | 87.6 /100 | #133 | Excellent 13.0% |
| Afghans | 85.8 /100 | #134 | Excellent 13.0% |
| South Africans | 85.7 /100 | #135 | Excellent 13.0% |