Hmong vs Syrian Median Male Earnings
COMPARE
Hmong
Syrian
Median Male Earnings
Median Male Earnings Comparison
Hmong
Syrians
$48,254
MEDIAN MALE EARNINGS
0.2/ 100
METRIC RATING
279th/ 347
METRIC RANK
$58,187
MEDIAN MALE EARNINGS
97.4/ 100
METRIC RATING
102nd/ 347
METRIC RANK
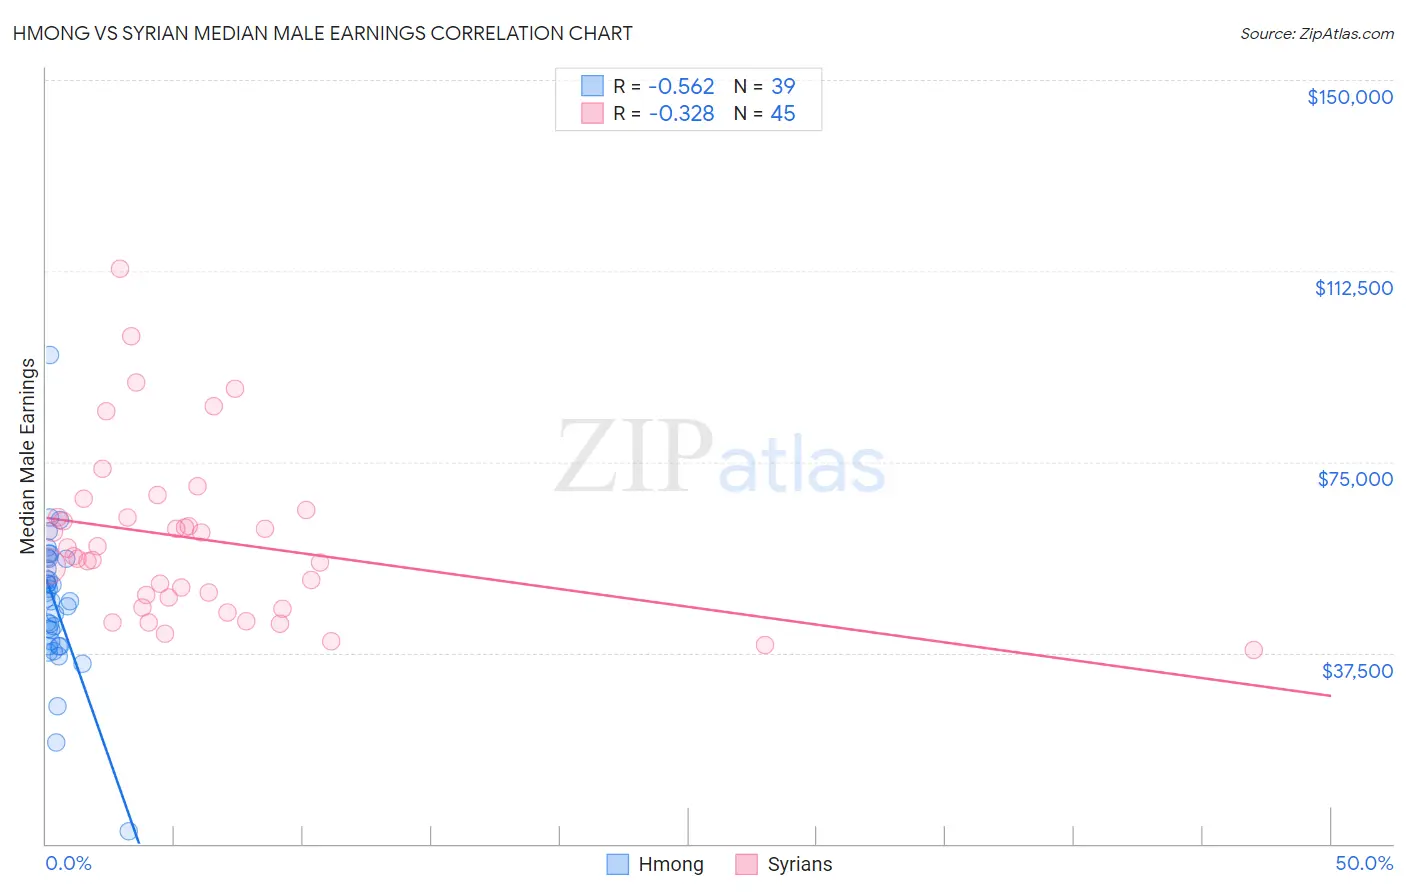
Hmong vs Syrian Median Male Earnings Correlation Chart
The statistical analysis conducted on geographies consisting of 24,672,334 people shows a substantial negative correlation between the proportion of Hmong and median male earnings in the United States with a correlation coefficient (R) of -0.562 and weighted average of $48,254. Similarly, the statistical analysis conducted on geographies consisting of 266,273,099 people shows a mild negative correlation between the proportion of Syrians and median male earnings in the United States with a correlation coefficient (R) of -0.328 and weighted average of $58,187, a difference of 20.6%.
Median Male Earnings Correlation Summary
| Measurement | Hmong | Syrian |
| Minimum | $2,499 | $38,125 |
| Maximum | $95,990 | $112,858 |
| Range | $93,491 | $74,733 |
| Mean | $47,121 | $59,779 |
| Median | $47,633 | $56,452 |
| Interquartile 25% (IQ1) | $38,872 | $47,297 |
| Interquartile 75% (IQ3) | $55,920 | $64,910 |
| Interquartile Range (IQR) | $17,048 | $17,614 |
| Standard Deviation (Sample) | $14,307 | $16,573 |
| Standard Deviation (Population) | $14,122 | $16,388 |
Similar Demographics by Median Male Earnings
Demographics Similar to Hmong by Median Male Earnings
In terms of median male earnings, the demographic groups most similar to Hmong are Comanche ($48,202, a difference of 0.11%), Immigrants from Liberia ($48,317, a difference of 0.13%), Belizean ($48,358, a difference of 0.22%), Marshallese ($48,137, a difference of 0.24%), and Blackfeet ($48,402, a difference of 0.31%).
| Demographics | Rating | Rank | Median Male Earnings |
| Salvadorans | 0.3 /100 | #272 | Tragic $48,646 |
| Jamaicans | 0.3 /100 | #273 | Tragic $48,632 |
| Colville | 0.3 /100 | #274 | Tragic $48,516 |
| Immigrants | Somalia | 0.3 /100 | #275 | Tragic $48,439 |
| Blackfeet | 0.3 /100 | #276 | Tragic $48,402 |
| Belizeans | 0.2 /100 | #277 | Tragic $48,358 |
| Immigrants | Liberia | 0.2 /100 | #278 | Tragic $48,317 |
| Hmong | 0.2 /100 | #279 | Tragic $48,254 |
| Comanche | 0.2 /100 | #280 | Tragic $48,202 |
| Marshallese | 0.2 /100 | #281 | Tragic $48,137 |
| Central Americans | 0.2 /100 | #282 | Tragic $48,093 |
| Immigrants | Jamaica | 0.2 /100 | #283 | Tragic $48,040 |
| Africans | 0.2 /100 | #284 | Tragic $47,994 |
| Paiute | 0.2 /100 | #285 | Tragic $47,991 |
| Mexican American Indians | 0.2 /100 | #286 | Tragic $47,990 |
Demographics Similar to Syrians by Median Male Earnings
In terms of median male earnings, the demographic groups most similar to Syrians are Polish ($58,139, a difference of 0.080%), Armenian ($58,134, a difference of 0.090%), Immigrants from Western Asia ($58,131, a difference of 0.10%), Immigrants from Brazil ($58,324, a difference of 0.24%), and Immigrants from Northern Africa ($58,008, a difference of 0.31%).
| Demographics | Rating | Rank | Median Male Earnings |
| Immigrants | Lebanon | 98.6 /100 | #95 | Exceptional $58,835 |
| Albanians | 98.4 /100 | #96 | Exceptional $58,680 |
| Northern Europeans | 98.2 /100 | #97 | Exceptional $58,588 |
| Jordanians | 98.1 /100 | #98 | Exceptional $58,500 |
| Immigrants | Poland | 98.0 /100 | #99 | Exceptional $58,452 |
| Assyrians/Chaldeans/Syriacs | 97.9 /100 | #100 | Exceptional $58,437 |
| Immigrants | Brazil | 97.7 /100 | #101 | Exceptional $58,324 |
| Syrians | 97.4 /100 | #102 | Exceptional $58,187 |
| Poles | 97.3 /100 | #103 | Exceptional $58,139 |
| Armenians | 97.3 /100 | #104 | Exceptional $58,134 |
| Immigrants | Western Asia | 97.3 /100 | #105 | Exceptional $58,131 |
| Immigrants | Northern Africa | 96.9 /100 | #106 | Exceptional $58,008 |
| Serbians | 96.8 /100 | #107 | Exceptional $57,975 |
| Immigrants | Uzbekistan | 96.7 /100 | #108 | Exceptional $57,941 |
| British | 96.5 /100 | #109 | Exceptional $57,890 |