Marshallese vs South African Median Male Earnings
COMPARE
Marshallese
South African
Median Male Earnings
Median Male Earnings Comparison
Marshallese
South Africans
$48,137
MEDIAN MALE EARNINGS
0.2/ 100
METRIC RATING
281st/ 347
METRIC RANK
$61,460
MEDIAN MALE EARNINGS
99.9/ 100
METRIC RATING
53rd/ 347
METRIC RANK
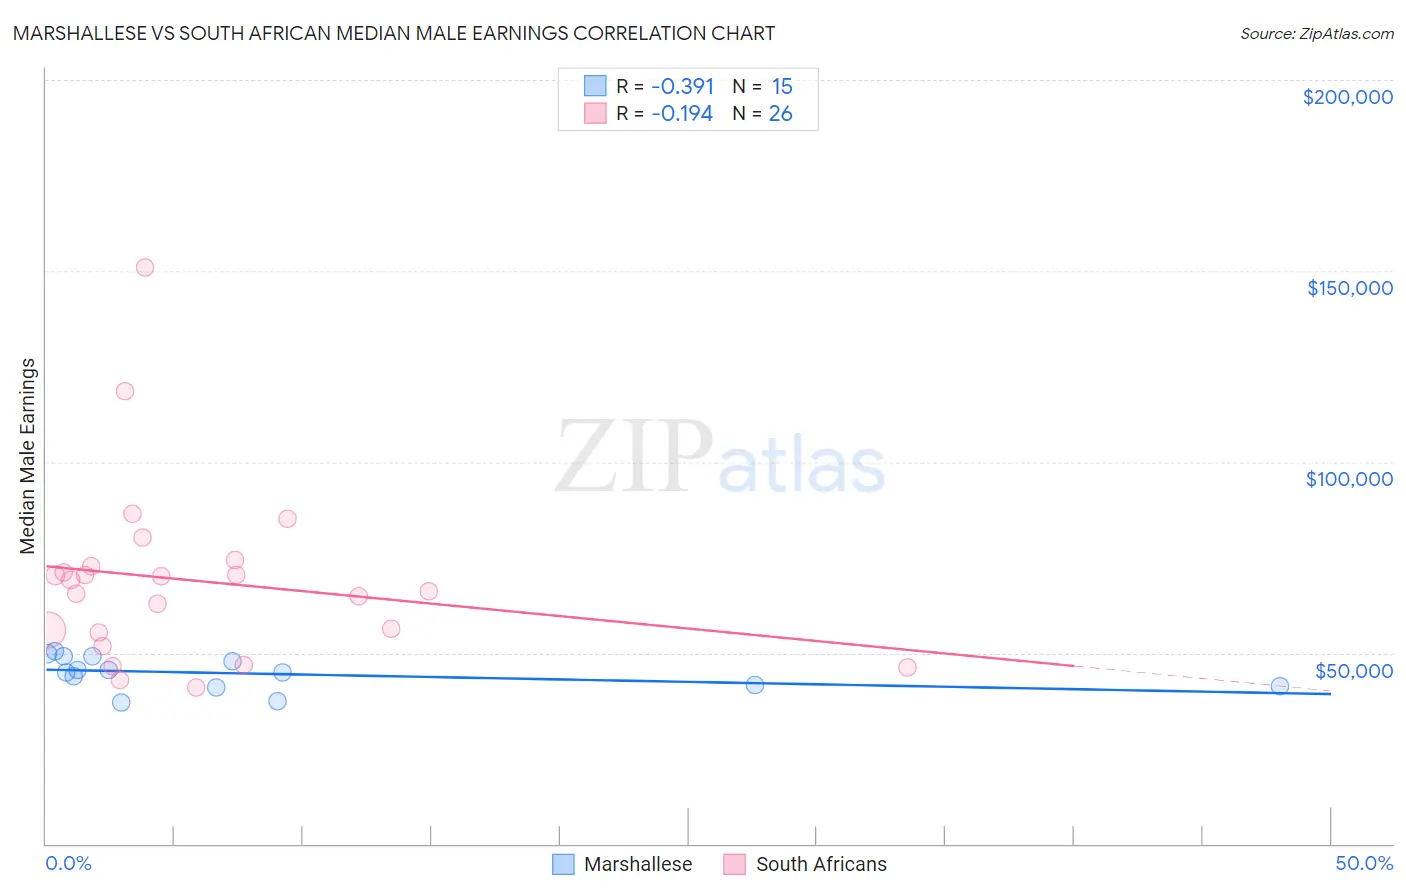
Marshallese vs South African Median Male Earnings Correlation Chart
The statistical analysis conducted on geographies consisting of 14,760,790 people shows a mild negative correlation between the proportion of Marshallese and median male earnings in the United States with a correlation coefficient (R) of -0.391 and weighted average of $48,137. Similarly, the statistical analysis conducted on geographies consisting of 182,591,048 people shows a poor negative correlation between the proportion of South Africans and median male earnings in the United States with a correlation coefficient (R) of -0.194 and weighted average of $61,460, a difference of 27.7%.
Median Male Earnings Correlation Summary
| Measurement | Marshallese | South African |
| Minimum | $37,012 | $40,972 |
| Maximum | $50,395 | $150,965 |
| Range | $13,383 | $109,993 |
| Mean | $44,583 | $68,892 |
| Median | $45,000 | $67,477 |
| Interquartile 25% (IQ1) | $41,333 | $55,347 |
| Interquartile 75% (IQ3) | $48,969 | $72,701 |
| Interquartile Range (IQR) | $7,636 | $17,354 |
| Standard Deviation (Sample) | $4,286 | $23,483 |
| Standard Deviation (Population) | $4,141 | $23,027 |
Similar Demographics by Median Male Earnings
Demographics Similar to Marshallese by Median Male Earnings
In terms of median male earnings, the demographic groups most similar to Marshallese are Central American ($48,093, a difference of 0.090%), Comanche ($48,202, a difference of 0.13%), Immigrants from Jamaica ($48,040, a difference of 0.20%), Hmong ($48,254, a difference of 0.24%), and African ($47,994, a difference of 0.30%).
| Demographics | Rating | Rank | Median Male Earnings |
| Colville | 0.3 /100 | #274 | Tragic $48,516 |
| Immigrants | Somalia | 0.3 /100 | #275 | Tragic $48,439 |
| Blackfeet | 0.3 /100 | #276 | Tragic $48,402 |
| Belizeans | 0.2 /100 | #277 | Tragic $48,358 |
| Immigrants | Liberia | 0.2 /100 | #278 | Tragic $48,317 |
| Hmong | 0.2 /100 | #279 | Tragic $48,254 |
| Comanche | 0.2 /100 | #280 | Tragic $48,202 |
| Marshallese | 0.2 /100 | #281 | Tragic $48,137 |
| Central Americans | 0.2 /100 | #282 | Tragic $48,093 |
| Immigrants | Jamaica | 0.2 /100 | #283 | Tragic $48,040 |
| Africans | 0.2 /100 | #284 | Tragic $47,994 |
| Paiute | 0.2 /100 | #285 | Tragic $47,991 |
| Mexican American Indians | 0.2 /100 | #286 | Tragic $47,990 |
| Immigrants | El Salvador | 0.2 /100 | #287 | Tragic $47,973 |
| Shoshone | 0.2 /100 | #288 | Tragic $47,930 |
Demographics Similar to South Africans by Median Male Earnings
In terms of median male earnings, the demographic groups most similar to South Africans are Immigrants from Latvia ($61,422, a difference of 0.060%), Immigrants from Norway ($61,628, a difference of 0.27%), Greek ($61,242, a difference of 0.36%), Lithuanian ($61,228, a difference of 0.38%), and Immigrants from Scotland ($61,220, a difference of 0.39%).
| Demographics | Rating | Rank | Median Male Earnings |
| Immigrants | Czechoslovakia | 99.9 /100 | #46 | Exceptional $62,217 |
| Immigrants | Austria | 99.9 /100 | #47 | Exceptional $62,164 |
| Immigrants | Malaysia | 99.9 /100 | #48 | Exceptional $62,121 |
| Immigrants | Europe | 99.9 /100 | #49 | Exceptional $62,057 |
| Bhutanese | 99.9 /100 | #50 | Exceptional $61,759 |
| Estonians | 99.9 /100 | #51 | Exceptional $61,710 |
| Immigrants | Norway | 99.9 /100 | #52 | Exceptional $61,628 |
| South Africans | 99.9 /100 | #53 | Exceptional $61,460 |
| Immigrants | Latvia | 99.9 /100 | #54 | Exceptional $61,422 |
| Greeks | 99.9 /100 | #55 | Exceptional $61,242 |
| Lithuanians | 99.9 /100 | #56 | Exceptional $61,228 |
| Immigrants | Scotland | 99.9 /100 | #57 | Exceptional $61,220 |
| New Zealanders | 99.9 /100 | #58 | Exceptional $61,199 |
| Immigrants | Netherlands | 99.8 /100 | #59 | Exceptional $61,096 |
| Egyptians | 99.8 /100 | #60 | Exceptional $61,095 |