Asian vs South African Median Male Earnings
COMPARE
Asian
South African
Median Male Earnings
Median Male Earnings Comparison
Asians
South Africans
$63,827
MEDIAN MALE EARNINGS
100.0/ 100
METRIC RATING
29th/ 347
METRIC RANK
$61,460
MEDIAN MALE EARNINGS
99.9/ 100
METRIC RATING
53rd/ 347
METRIC RANK
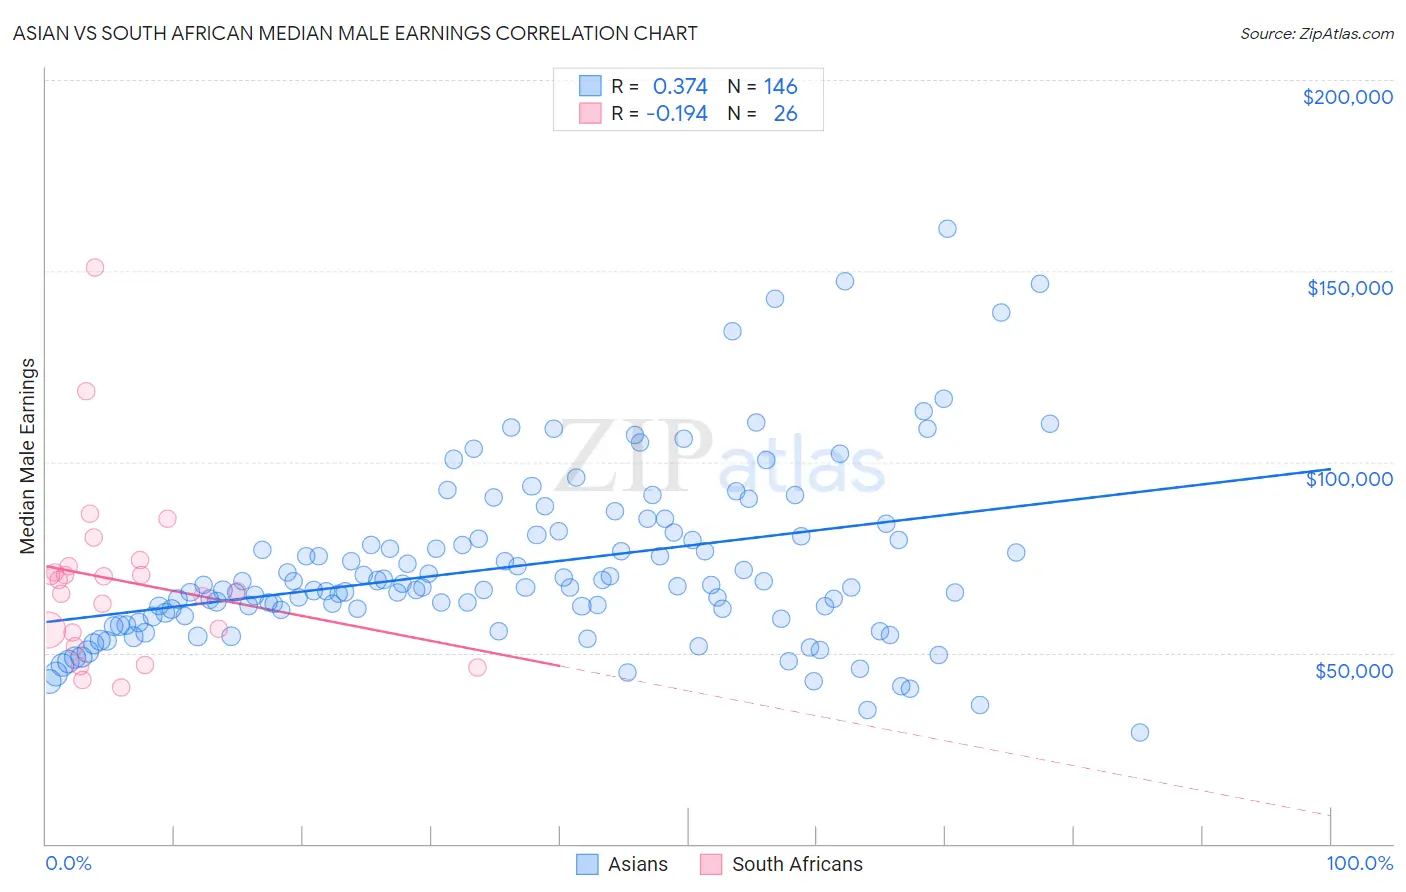
Asian vs South African Median Male Earnings Correlation Chart
The statistical analysis conducted on geographies consisting of 550,236,506 people shows a mild positive correlation between the proportion of Asians and median male earnings in the United States with a correlation coefficient (R) of 0.374 and weighted average of $63,827. Similarly, the statistical analysis conducted on geographies consisting of 182,591,048 people shows a poor negative correlation between the proportion of South Africans and median male earnings in the United States with a correlation coefficient (R) of -0.194 and weighted average of $61,460, a difference of 3.8%.
Median Male Earnings Correlation Summary
| Measurement | Asian | South African |
| Minimum | $29,236 | $40,972 |
| Maximum | $160,917 | $150,965 |
| Range | $131,681 | $109,993 |
| Mean | $72,799 | $68,892 |
| Median | $67,194 | $67,477 |
| Interquartile 25% (IQ1) | $59,553 | $55,347 |
| Interquartile 75% (IQ3) | $80,527 | $72,701 |
| Interquartile Range (IQR) | $20,975 | $17,354 |
| Standard Deviation (Sample) | $23,189 | $23,483 |
| Standard Deviation (Population) | $23,109 | $23,027 |
Similar Demographics by Median Male Earnings
Demographics Similar to Asians by Median Male Earnings
In terms of median male earnings, the demographic groups most similar to Asians are Russian ($63,939, a difference of 0.17%), Immigrants from Switzerland ($63,944, a difference of 0.18%), Immigrants from France ($63,715, a difference of 0.18%), Latvian ($63,498, a difference of 0.52%), and Turkish ($64,253, a difference of 0.67%).
| Demographics | Rating | Rank | Median Male Earnings |
| Burmese | 100.0 /100 | #22 | Exceptional $65,236 |
| Immigrants | Korea | 100.0 /100 | #23 | Exceptional $65,079 |
| Immigrants | Northern Europe | 100.0 /100 | #24 | Exceptional $64,987 |
| Immigrants | Denmark | 100.0 /100 | #25 | Exceptional $64,625 |
| Turks | 100.0 /100 | #26 | Exceptional $64,253 |
| Immigrants | Switzerland | 100.0 /100 | #27 | Exceptional $63,944 |
| Russians | 100.0 /100 | #28 | Exceptional $63,939 |
| Asians | 100.0 /100 | #29 | Exceptional $63,827 |
| Immigrants | France | 100.0 /100 | #30 | Exceptional $63,715 |
| Latvians | 100.0 /100 | #31 | Exceptional $63,498 |
| Soviet Union | 100.0 /100 | #32 | Exceptional $63,382 |
| Immigrants | Lithuania | 100.0 /100 | #33 | Exceptional $63,346 |
| Immigrants | Russia | 100.0 /100 | #34 | Exceptional $63,326 |
| Immigrants | Asia | 100.0 /100 | #35 | Exceptional $63,240 |
| Israelis | 100.0 /100 | #36 | Exceptional $63,228 |
Demographics Similar to South Africans by Median Male Earnings
In terms of median male earnings, the demographic groups most similar to South Africans are Immigrants from Latvia ($61,422, a difference of 0.060%), Immigrants from Norway ($61,628, a difference of 0.27%), Greek ($61,242, a difference of 0.36%), Lithuanian ($61,228, a difference of 0.38%), and Immigrants from Scotland ($61,220, a difference of 0.39%).
| Demographics | Rating | Rank | Median Male Earnings |
| Immigrants | Czechoslovakia | 99.9 /100 | #46 | Exceptional $62,217 |
| Immigrants | Austria | 99.9 /100 | #47 | Exceptional $62,164 |
| Immigrants | Malaysia | 99.9 /100 | #48 | Exceptional $62,121 |
| Immigrants | Europe | 99.9 /100 | #49 | Exceptional $62,057 |
| Bhutanese | 99.9 /100 | #50 | Exceptional $61,759 |
| Estonians | 99.9 /100 | #51 | Exceptional $61,710 |
| Immigrants | Norway | 99.9 /100 | #52 | Exceptional $61,628 |
| South Africans | 99.9 /100 | #53 | Exceptional $61,460 |
| Immigrants | Latvia | 99.9 /100 | #54 | Exceptional $61,422 |
| Greeks | 99.9 /100 | #55 | Exceptional $61,242 |
| Lithuanians | 99.9 /100 | #56 | Exceptional $61,228 |
| Immigrants | Scotland | 99.9 /100 | #57 | Exceptional $61,220 |
| New Zealanders | 99.9 /100 | #58 | Exceptional $61,199 |
| Immigrants | Netherlands | 99.8 /100 | #59 | Exceptional $61,096 |
| Egyptians | 99.8 /100 | #60 | Exceptional $61,095 |